IN SPEED WE TRUST
NinjaTrader is the best platform out there. Use it wisely.
How to prevent NinjaTrader lag:
1) Uninstall all freebie indicators,
2) Replace Footprint: Replace lagging indicators
3) Install the optimized-for-speed Footprint from BestOrderFlow.com .
5) Replace Heatmap from Bookmap with NEW Heatmap
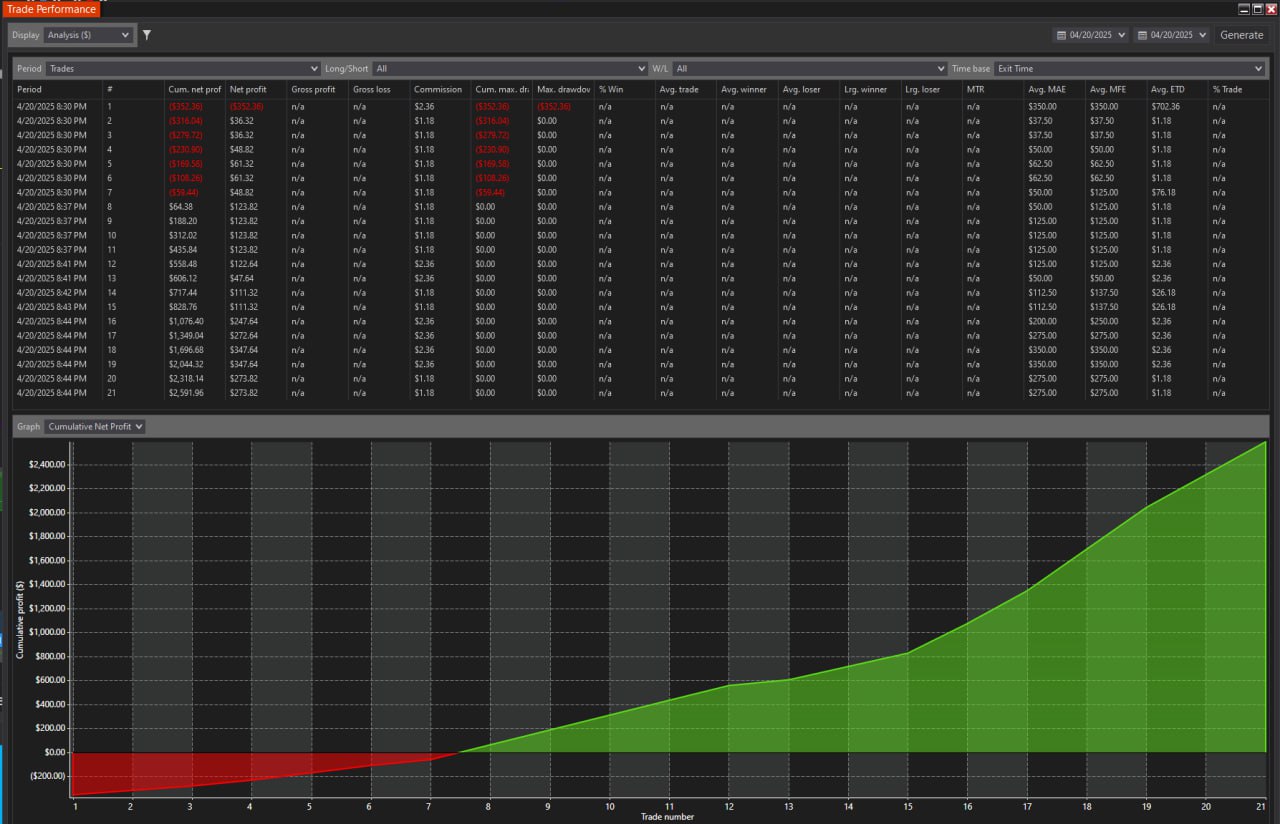
Trust your own test, not claims:
Do not rely on our tests and results to compare indicators on speed and performance. You can compare indicators yourself. The Deposit Killer indicator helps you to compare CPU performance, lag time, and render time for any indicator on your charts.
Do you have free or cheap indicators killing your chart performance?
- With every second chart delay, you lose at least $50 on 1 contract. Why should you
- Compare the performance of indicators on your charts
- Ditch out indicators that are not performing as champions.
Can your Indicators survive a high volatility test?
Here is what they never want you to know:
- Run the free Deposit Killer Indicator to find out objective data results.
- Evaluate each indicator on your chart to assess its actual performance.
- Trust only the data revealed in the comparison test during periods of high volatility.
- With Deposit Killer, you can test any indicator and chart.
- Use our step-by-step guide to test indicators correctly, ensuring the most accurate and reliable results.
- Download and follow the step-by-step manual and video explainer to test any indicators and charts.
HOW TO KEEP YOUR CHARTS AT MAXIMUM PERFORMANCE
Clean up the NinjaTrader platform daily:
- Data irregularities may cause charts to look weird.
- Small data interruptions may cause errors to pop up on a chart
- By cleaning data interruptions, we may restore data
- Select Reload All Data on a chart to fix data irregularities.
It is highly recommended to clean all files, including Data files and Cache files. After cleaning the NT platform data, open your chart and select Reload All Data. This may help resolve many common issues.
NT Optimizer is a powerful and straightforward solution for cleaning up the NT platform. Your NT platform will run faster and with fewer errors. Use it daily.
NT Optimizer buttons guide:
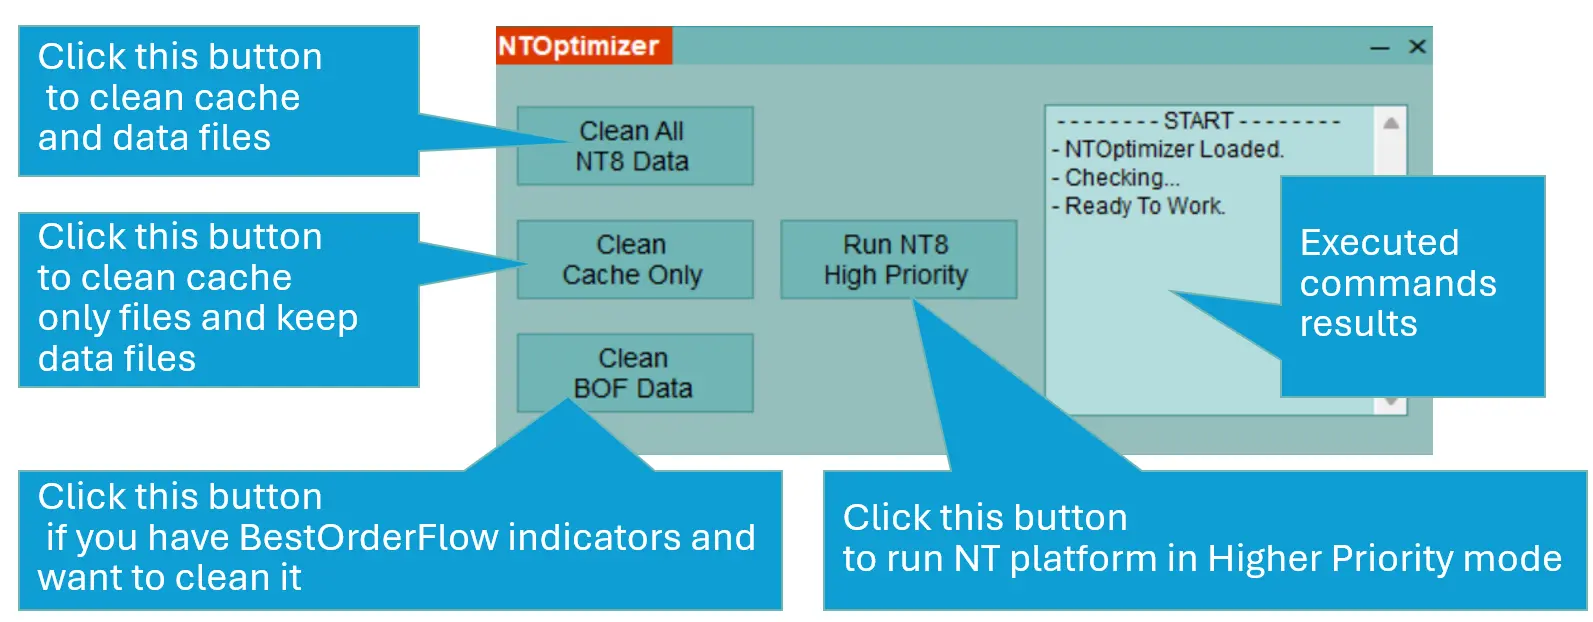
1) Unzip the file in any folder or on your desktop
2) Windows Defender or any other Antivirus will not recognize this file because it is new. Let it run.
3) Double-click on NTOptimizer.exe file to install the program.
4) Make sure your NinjaTrader 8 is not running. Close NinjaTrader before using the NT optimizer
Steps to identify indicators that slow your charts' performance:
1) Download and install the DepositKiller Indicator file
2) Download Deposit Killer user guide - manual:
Other tips to run NinjaTrader charts faster:
- Please install and use only the latest Desktop version of the NinjaTrader Platform on your desktop from http://ninjaTrader.com
- Set indicator calculations to "On Bar Close" or "On Price Change" rather than "On Each Tick".
- Minimize the number of open charts, workspaces, and instruments.
- Reduce data load by limiting "Days to Load".
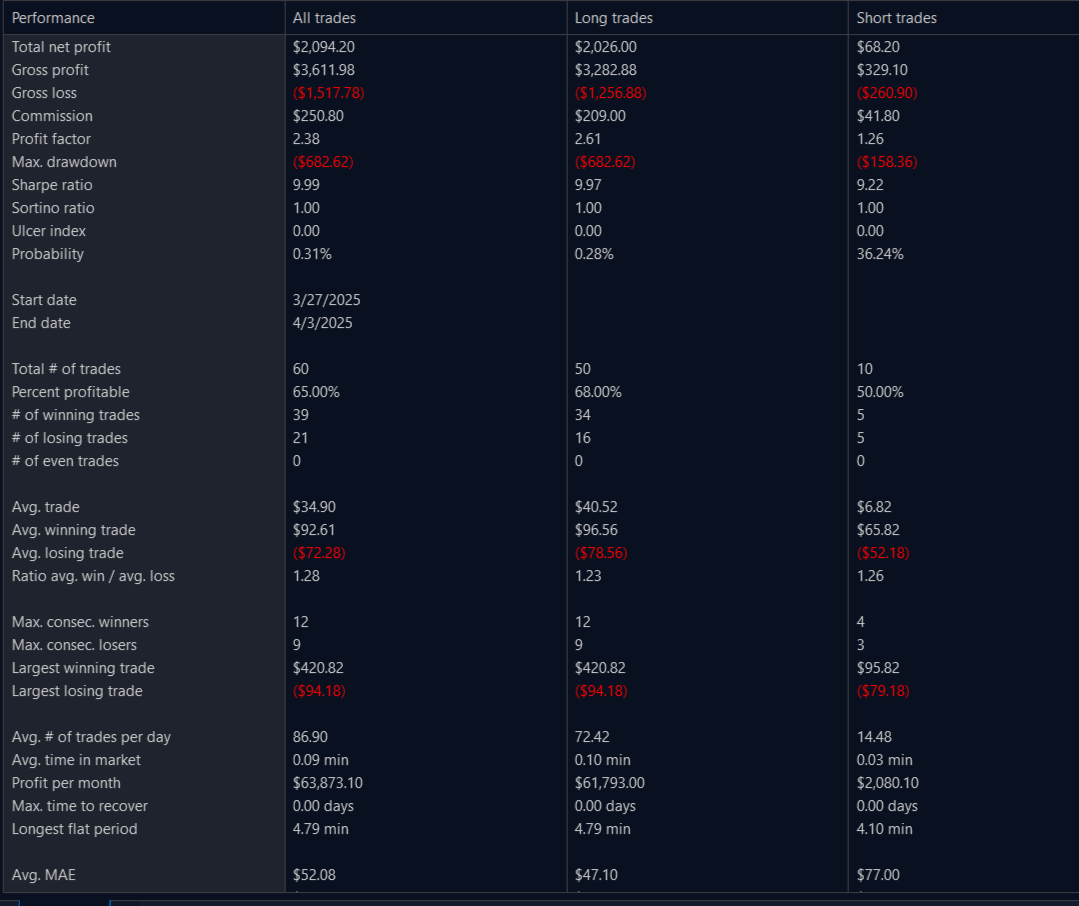
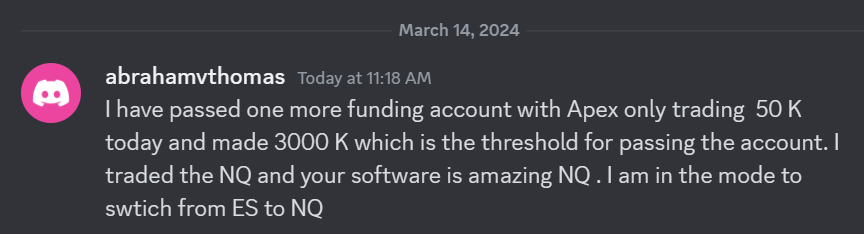 I have passed one more funding account with Apex Trading today and made $3,000, which is the threshold for passing the account. I traded NQ, and the Bestorderflow indicators are excellent for passing props.