Heatmap from Bookmap compared to NEW HEATMAP
The old heatmap from Bookmap.com looks pretty nice until it is seriously tested and challenged by the NEW HEATMAP developed over the past few months. After years of using it and learning the app, we found deficiencies of old heatmap that every trader must know.
NinjaTrader users now get faster and better Heatmap charts compared to the Heatmap from Bookmap. What makes the Bookmap heatmap in NinjaTrader unpleasant to use? Here are a few key points:
- Old heatmap from Bookmap is slow and lags on high-volatility charts at Market Open. It gets frozen and skips the chart rendering that becomes visible on the chart.
- Old heatmap from Bookmap does not accurately display the heatmap and provides false information in the chart at the aggregation and price combination when data is summarised to show only a few price levels.
- The old Bookmap's heatmap is cluttered. The charts in ES and MES are always clattering with bots and algos that are hard or impossible to remove. It is hard to trade when a heatmap is cluttered.
- Old heatmap bubbles are not properly sized, and there is no information about each bubble's size. Bubbles on Bookmap obstruct the heatmap view.
- The old Bookmap's heatmap can overload the computer's CPU, causing laptops and desktops to overheat quickly.
- The Bookmap's heatmap is not integrated with Footprint.
- The Bookmap heatmap is not integrated with other indicators on the trading platform, such as NinjaTrader.
- You have to dedicate a separate monitor to the Heatmap from Bookmap. What if you don't have an extra monitor?
- Bokmap's Heatmap version does not allow you to trade directly from the Heatmap Chart because it is not integrated with the NinjaTrader trading platform.
- Old Bookmap's heatmap color scheme uses the same set of colors for bid and ask. It takes some mental energy for a trader to distinguish passive sellers from passive buyers.
- The old Bookmap's heatmap is not fully integrated with MBO Market by Order indicators.
- Bookmap is distancing itself from Iceberg indicators. Iceberg indicators on a heatmap no longer make sense. Traders don't know when to use and when to avoid using icebergs, this heatmap.
What is the new Heatmap used instead of Hetamap in Bookmap? New Heatmap that is easier to use, called NEW HEATMAP from bestorderflow.com
There are a few other heatmap indicators out there, and the NEW HEATMAP from bestorderflow.com is the only one that keeps working during critical times during a high-volatility NY open and does not freeze, unlike all the others.
NEW HEATMAP is an order book, an electronic registry of buy and sell orders organized by price level for specific securities. NEW HEATMAP indicators show interactions between aggressive and passive participants in the order flow.
NEW HEATMAP helps better understand why prices move. The NEW HEATMAP from BestOrderflow.com is better alternative to the Old Heatmap from Bookmap.. .
Price moved due to interactions between buyers and sellers. Most traders do not understand that aggressive buyers cannot interact with aggressive sellers on the same side of the order flow. The passive sellers do not interact with passive buyers on the passive side of the orderflow. NEW HEATMAP indicators, such as heatmap, show resting passive orders liquidity waiting for the price to interact with the aggressive side of orderflow - aggressive orders by market. The Market Delta bubbles indicator shows the results of interaction on the aggressive side of the Order Flow. The Market Delta bubbles indicator shows aggressive participants being absorbed by passive participants.
Why does the Heatmap indicator need to be traded with the Footprint indicator on the same chart?
The Footprint over the heatmap shows who takes the upper hand in the fight between buyers and sellers. The NEW HEATMAP is a set of indicators that shows the interaction between both sides of the orderflow and which side impacts the price to move higher or lower.
The price can change due to the absence of passive participants, creating a vacuum of resistance. The price can change because passive participants provided more liquidity than aggressive sellers could absorb. The price can be changed because Agressive participants over power paqssive side of the orderflow. All of these scenarios are recorded in the NEW HEATMAP and provide data for a trader's interpretation and decision-making. NEW HEATMAP helps traders trade the entire Order Flow, not just one side, as presented in the Volume Profile or Footprint indicators.
What can NEW HEATMAP do that Heatmap from Bookmap does not? The short answer is: the old Heatmap from Bookmap shows only one side of orderflow, while the NEW HEATMAP shows both sides of the Order Flow.
NEW HEATMAP is a new Heatmap developed by bestorderflow.com.
NEW HEATMAP advantage over any other known Heatmap apps/ software indicators:
- NEW HEATMAP is fast at the high-volatility market open.
- NEW HEATMAP is lighter-coded than the old Bookmap Heatmap.
- NEW HEATMAP is optimized for Level 2 data performance during periods of critical volatility. It is a true champion among all Heatmaps ever tested for speed and performance benchmarks.
- NEW HEATMAP is fully integrated with Footprint, Volume Profile, and Market By Order indicators.
- Trades can be placed directly from the NEW HEATMAP charts, as the charts are fully integrated with the trading platform.
- NEW HEATMAP's heatmap integrated with Footprint. That means you can use both on the same chart, and that is a major improvement.
- NEW HEATMAP from https://bestorderflow.com is a complete order flow software that represents the interaction between the aggressive side of orderflow and the passive / limit orders side of the orderflow, making NEW HEATMAP a complete Order Flow software app indicator.
- NEW HEATMAP supports any other indicators installed on the same chart, allowing traders to use their favorite indicators alongside NEW HEATMAP.
- NEW HEATMAP provides accurate information with price level aggregation. Accuracy of information is the number one priority for any indicator, especially on the Heatmap.
- NEW HEATMAP's heatmap supports more color scheme variations and allows the bid color to differ from the ask colors. The enhanced color scheme and more color scheme variations help traders make trading decisions in a snap, without extra thought on distinguishing passive sellers from passive buyers.
- The Heatmap from NEW HEATMAP is fully integrated with MBO Market via the Order indicator. It is integrated on the same chart and is fully functional Market By Order DOM.
- This heatmap from bestorderflow.com is integrated with the native Iceberg indicator. Iceberg indicators on a NEW HEATMAP make more sense and are easier to trade visually. Traders can distinguish two types of aceber directly on the heatmap and also on the DOM.
Conclusion: NEW HEATMAP from bestorderflow.com is 10 times faster and easier to render. NEW HEATMAP's heatmaps can be cleaned and filtered to remove unwanted elements, leaving a crystal-clear heatmap with the most important liquidity. NEW HEATMAP integrates with other indicators and complements any trading chart in NinjaTrader, allowing traders to use other indicators on the same chart alongside the heatmap. That eliminates the need for multiple displays and allows trading from the main chart, rather than requiring multiple charts and multiple monitors. NEW HEATMAP's heatmap uses significantly less CPU energy to process level 2 data and render it on the chart, resulting in faster, smoother, and more accurate data presentation. - There are a few other heatmap indicators out there, and the NEW HEATMAP from bestorderflow.com is the only one that keeps working during critical times during a high-volatility NY open and does not freeze, unlike all the others. Other heatmap does not save hisory and can not be used to rep[lay charts.
- NEW HEATMAP is the only Heatmap for NinjaTrade that is capable to save and record historical data and can be used to replay charts.
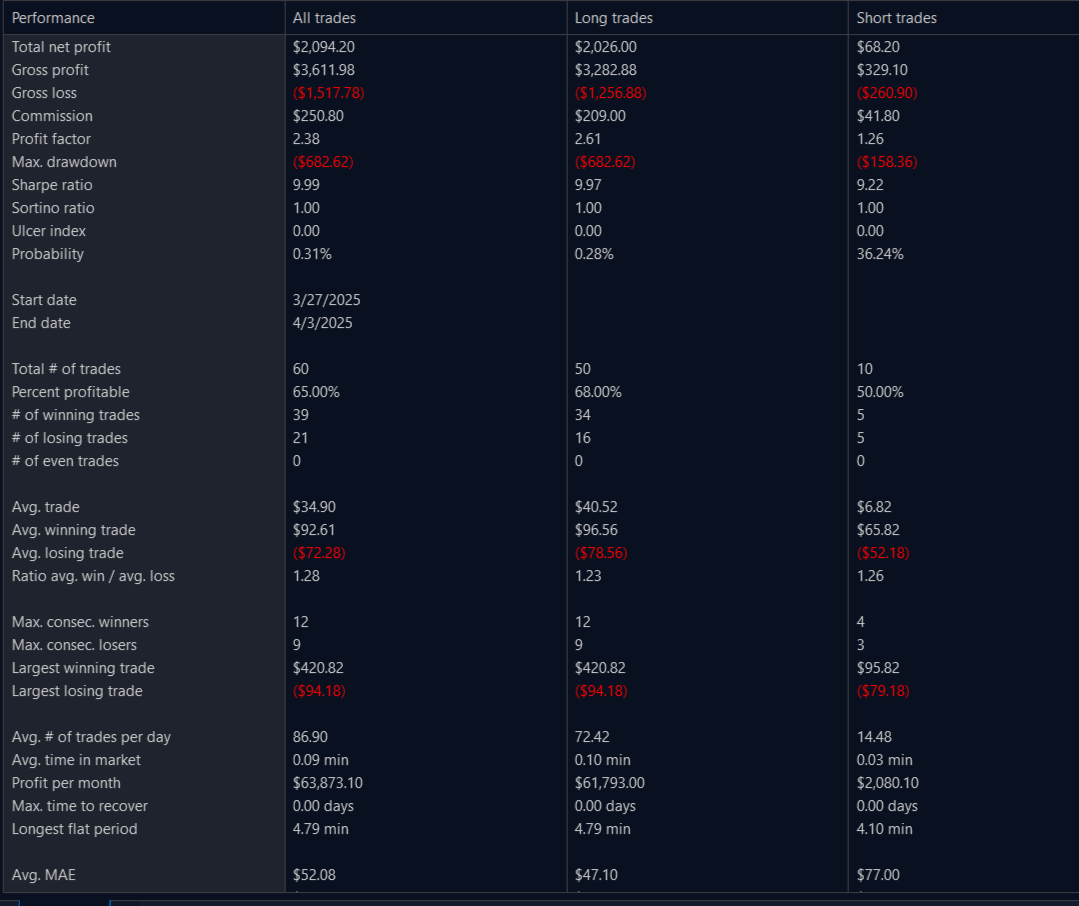
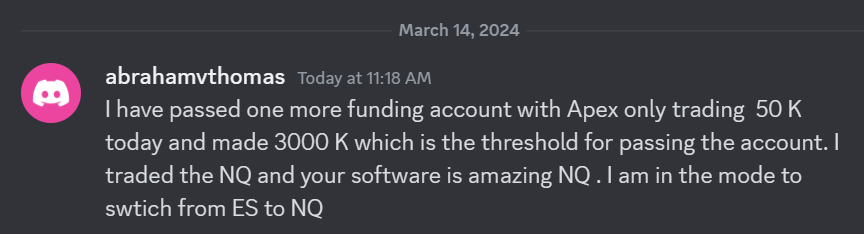 I have passed one more funding account with Apex Trading today and made $3,000, which is the threshold for passing the account. I traded NQ, and the Bestorderflow indicators are excellent for passing props.