HEATMAP PASSIVE VOLUME LIQUIDITY
NEW HEATMAP from bestorderflow.com is the only heatmap that works on the high-volatility NY open and does not freeze, unlike all others.
NEW HEATMAP: The Heatmap passive volume liquidity visualization indicator is 10 times faster in performance tests and more advanced than any other known heatmap.
‼️ Do you know that NEW HEATMAP is the only Heatmap for NinjaTrader that is capable to save and record historical data to replay charts?
Advanced features on the NEW HEATMAP:
NEW HEATMAP: Heatmap displays historical records of passive resting limit orders, represented by time and color.
The best for trading options, futures, and stocks. The NEW HEATMAP heatmap visualizes market depth data for level 2 passive limit orders on the order book. Used for Complete Order Flow trading by swing traders, day traders, and scalpers for precision entries. Designed to display the liquidity volume of an asset by color range. Support the evaluation of trading prop firms and master trading on proprietary firms and trading desk accounts. NEW HEATMAP is fully integrated with Footprint and Market By Order (mbo) indicator on the same chart.
NEW HEATMAP displays liquidity and helps identify the strength of support and resistance price levels and zones.
NEW HEATMAP can be traded on any timeframe, including milliseconds, seconds, minutes, and hours, unlike some other old-coded heatmaps, such as Bookmap.
Heatmap filters help to display immediate liquidity magnets for scalping and precision entries.
There is a lot of noise and insignificant volume orders on the ES that create a "tunnel" effect, which is impossible to remove on the Bookmap.
Now you can easily remove unwanted Market Maker noise using advanced filters in our NEW HEATMAP. This is an advanced feature not available on any other Heatmap indicators.
NEW HEATMAP SPEED AND PERFORMANCE:
The NEW HEATMAP from BestOrderFlow is the true champion in speed and performance tests: it is the only heatmap that remains operable. In contrast, all other heatmaps freeze during the high volatility on the NY market open.
Three other indicators froze after 8 minutes.
- With Deposit Killer, you can test any indicator and chart.
- Use our step-by-step guide to test indicators correctly and ensure the most accurate and reliable results.
- Download and follow the step-by-step manual and video explainer to test any indicators and charts.
-
- With every second chart delay, you lose at least $50 on 1 contract. Why should you?
- Compare the performance of indicators on your charts
Publicly Open Multi-Parameter Formula for Testing:
Data Lag Time - CPU waiting time
0 to 1 sec = Good
1 to 5 sec = Bad
5 + and more = Danger
Render Time
50 ms or less = Excellent
50 - 100 ms = Good
100 - 200 ms = Bad
200 and more = Danger
FPS - Frames per second
Excellent = 20 or more
Good = 10-20
Bad = 5-10
Danger = 0- 5
Overall Results:
Excellent = plenty of resources
Good = be careful with ATR volatility
Bad = stop immediately
Danger = big losses
Can your Indicators survive a high volatility test?
Here is what they never want you to know:
- Run the free Deposit Killer Indicator to find out objective data results.
- Evaluate each indicator on your chart to assess its actual performance.
- Trust only the data revealed in the comparison test during periods of high volatility.
1st USE HEATMAP RECOMMENDATIONS
1) Ensure you have a connection to the Level 2 data.
2) Close all charts. Start a new NQ or ES chart on a 1-second timeframe
 3) Ensure that Tick Replay is enabled in the Data Series.
4) Add NEW HEATMAP Heatmap on the chart. Use default settings: Volume Nin = 1, Hide volumes less than = 1, Ahow only after # bars= 1
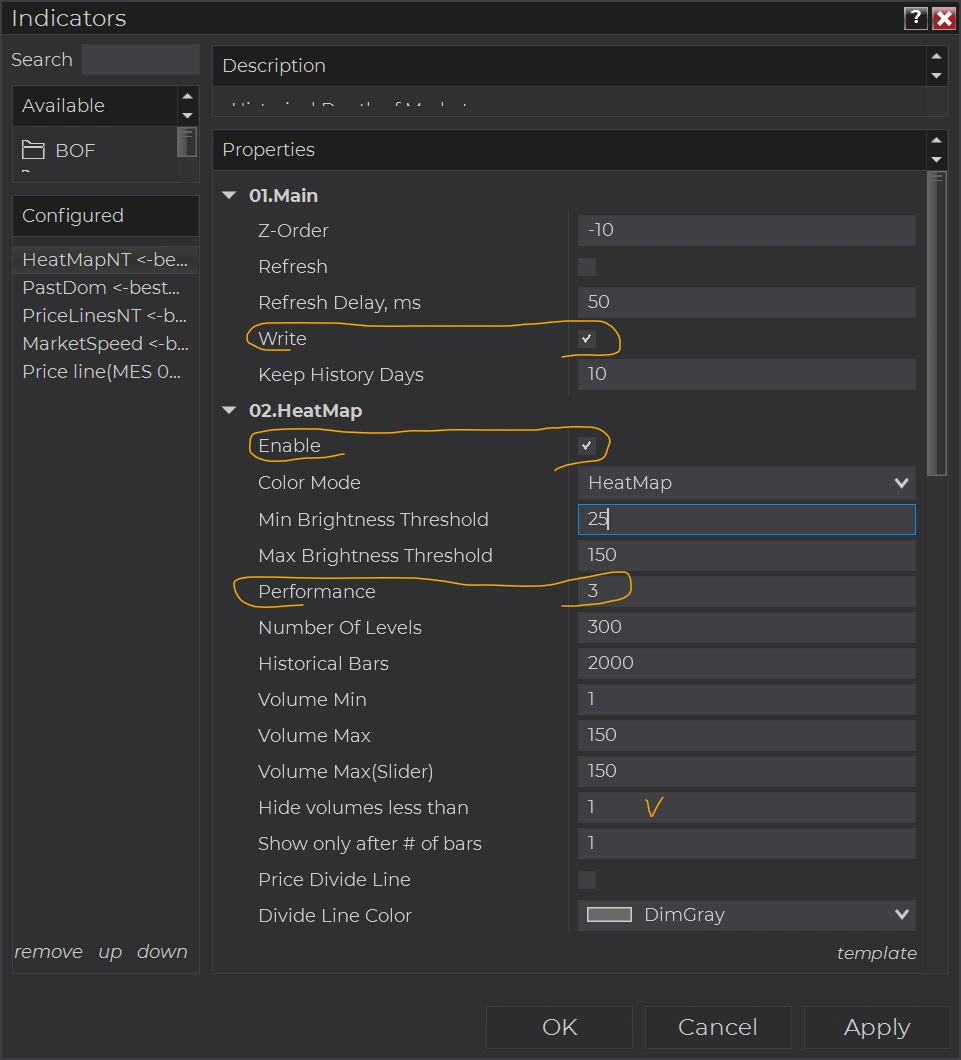
5) Check the 'Write' box if you want to keep the historical Heatmap.
6) Use three or fewer days to keep history
7) Set performance to 3 or 4 for less load on your computer's CPU. Setting performance to 1 produced crisper price levels, but it also increased the load on your CPU.
8) Option 02. Heatmap "Enable" - does not impact the option, Wright.
Option "Enable" - makes the Heatmap visually perform on that chart.
The "Enable" option can be disabled on the chart to conserve computer resources.
For example:
Use 1 chart to trade with options. The "Write" option is disabled to conserve resources. Option "Enable" is ON.
The 2nd chart with the same timeframe and ticker as on 1st, used only to "Write" the historical Heatmap without any interruptions. Check "Write" and Uncheck "Enable."
Refreshing the 1st chart with F5 or closing the 1st chart will not interrupt the historical recording of the Heatmap on the second chart.
There are a few heatmaps for NinjaTrader, and the NEW HEATMAP heatmap from bestorderflow.com is the only heatmap that keeps working during a high-volatility NY open and does not freeze, unlike all the others.
NEW HEATMAP is the only heatmap that works on the high-volatility NY open and does not freeze, unlike all others.
STRATEGIES WITH NEW HEATMAP:
Strategies used with indicators from the NEW HEATMAP in combination with other bestorderflow.com indicators
PACK 3 NEW HEATMAP INDICATORS LINKS
Links for PACK 3 NEW HEATMAP Indicators open in a new window:
- Pack 3 NEW HEATMAP indicators for NinjaTrader
- NEW HEATMAP indicator for NinjaTrader
- Market Delta bubbles on Heatmap Indicator for Ninjatrader
- PriceLines on NEW HEATMAP indicator for NinjaTrader - level 2 data
VIDEO + PDF MANUALS AND INSTRUCTIONS
Manuals / Instructions / Explainer about how to set up Heatmap, Heatmap Filters, Market Delta
Compare the old Heatmap from Bookmap and the new NEW HEATMAP from BestOrderFlow.com.
2
Video 1: Step-by-Step Tutorial - How to set up and tune the Heatmap on any timeframe and any instruments.
Video 2:
Russian language Heatmap User Manual Play List link
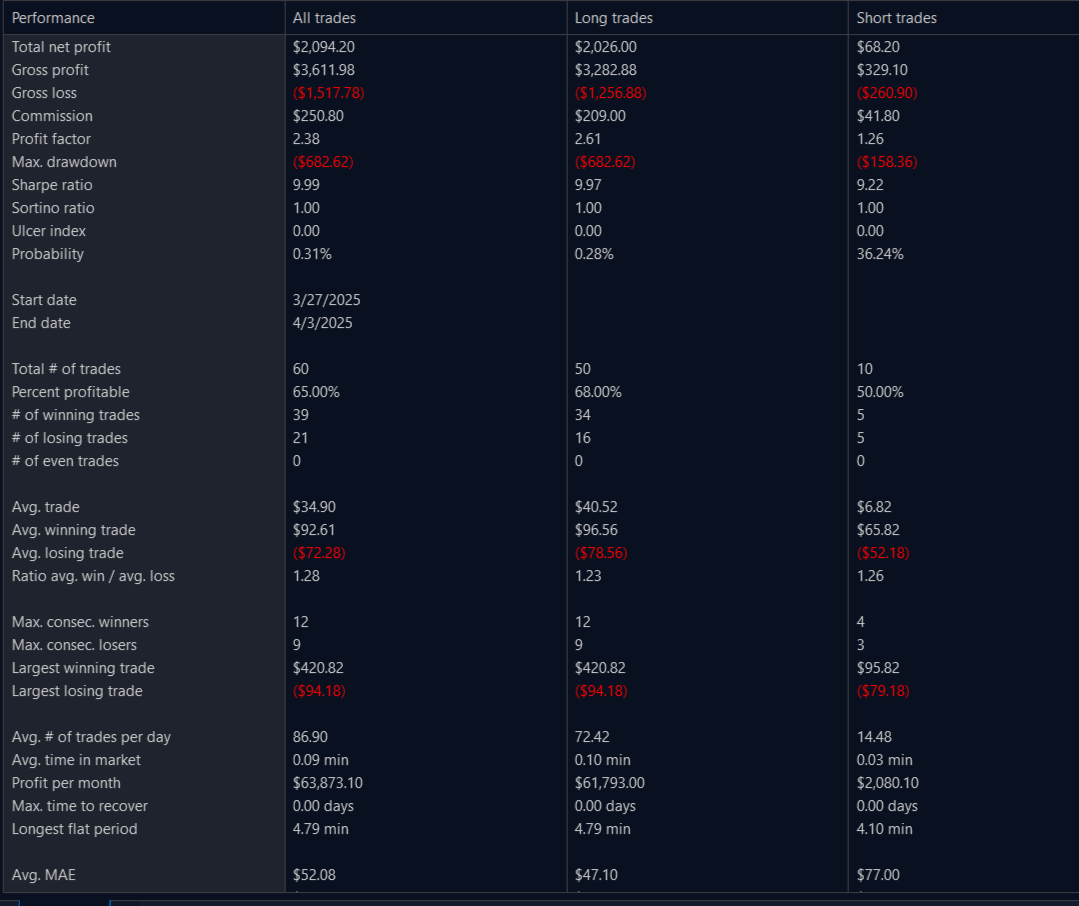
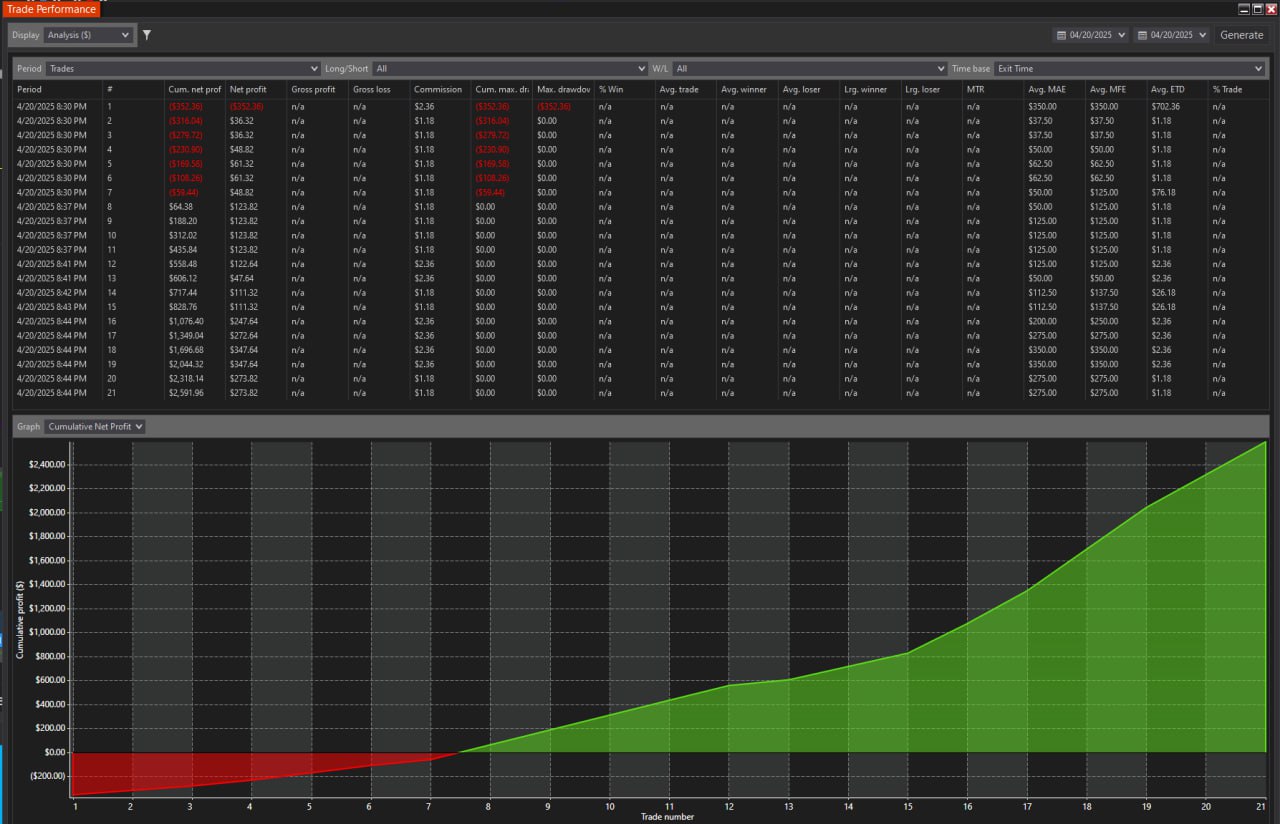
 I have passed one more funding account with Apex Trading today and made $3,000, which is the threshold for passing the account. I traded NQ, and the Bestorderflow indicators are excellent for passing props.