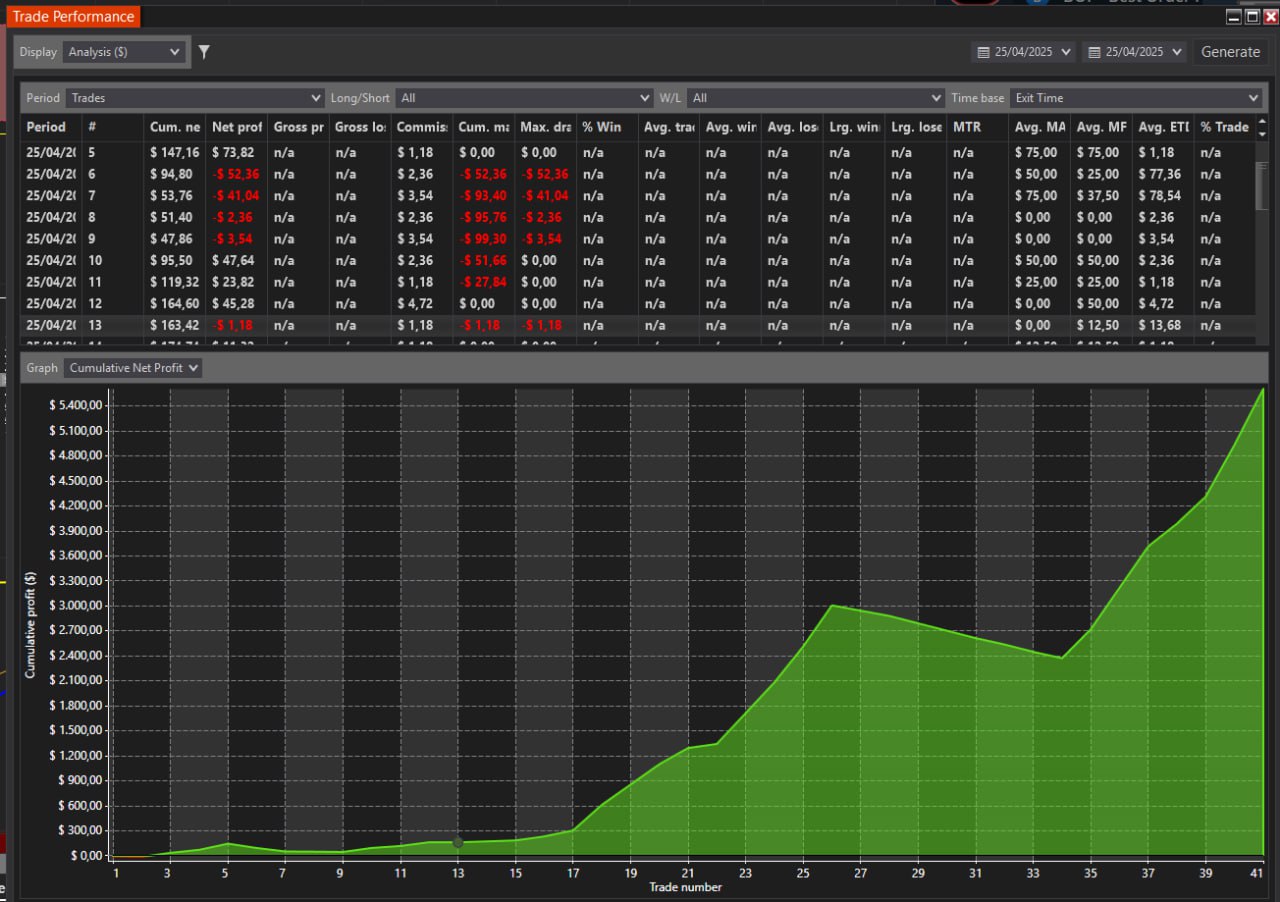
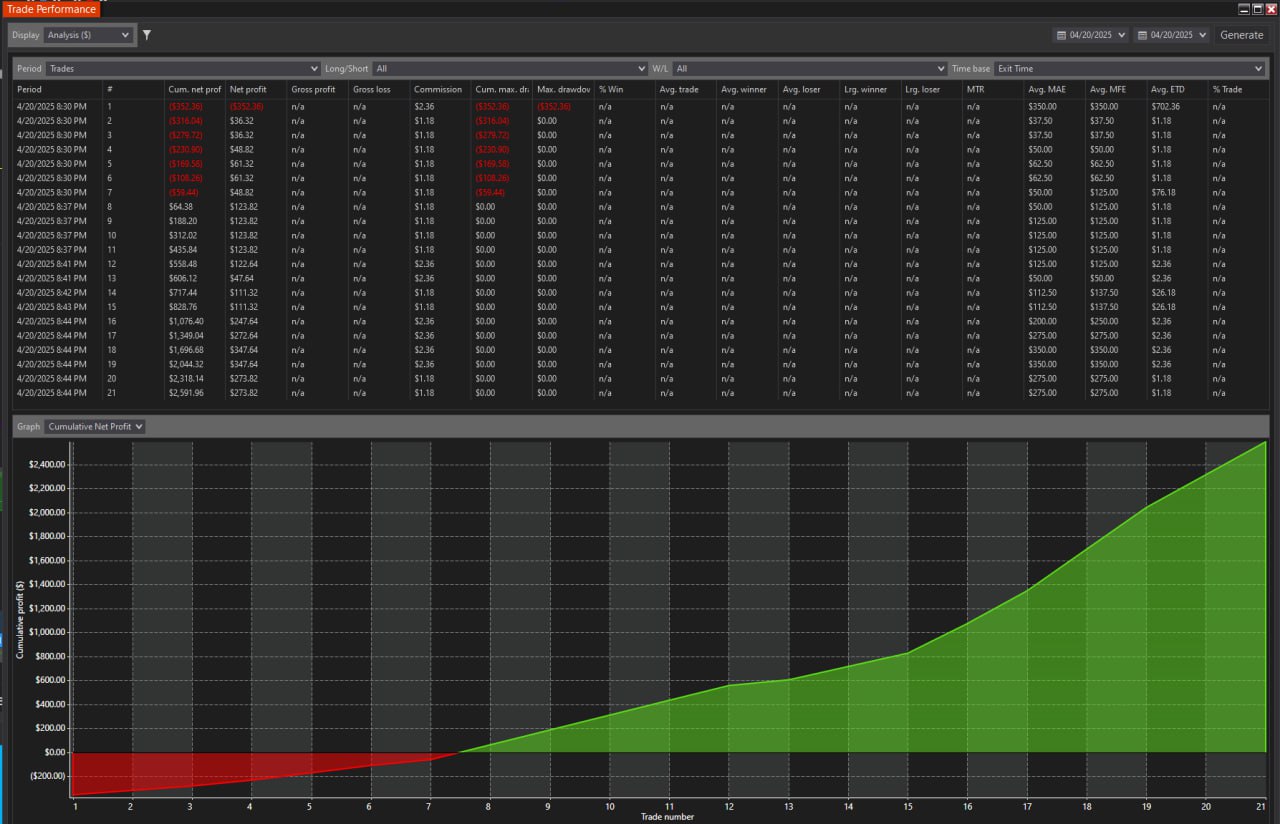
RESULTS
Taken from our Telegram and Discord community.
Testimonials appearing on this website may not represent those of other clients or customers and do not guarantee future performance or success.
abrahamvthomas
Verified user
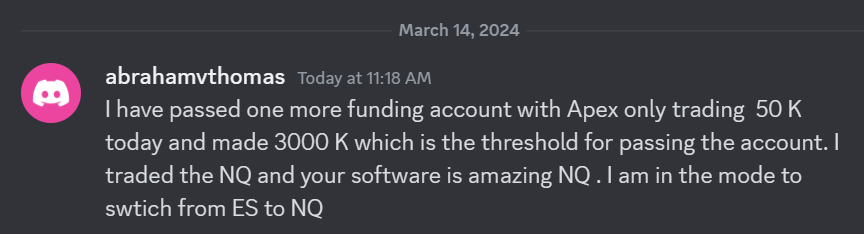 I have passed one more funding account with Apex Trading today and made $3,000, which is the threshold for passing the account. I traded NQ, and the Bestorderflow indicators are excellent for passing props.
Garban
Verified user
The MBO Market By Order indicator displays liquidity in real-time. Now I can see if a Support or Resistance Level can hold or become weak.
Fortunate
Verified user
5minutes of trading 1305-1310 GC ES NQ 15s chart with MBO max DCA 2 contracts open. Done for the day
Leandro
Verified user
I have tested and used indicators from many other vendors. The BestOrderFlow indicators are the best set of indicators for the NinjaTrader platform. It is lightweight and presents information in a visually appealing manner. That makes a lot of difference in my trading. I love to trade with MBO Market by Order indicator. Feel free to connect with me, and I can provide you with hundreds of screenshots of my results, if you'd like.
Game Changer for my Results
Fortunate. Verified user.
As an active trader, I can't say enough good things about the BestOrderFlow Delta Level 2 indicator. This set of indicators gave me an edge in my trading. It's like having a crystal ball for market movements! The way it tracks the speed of buyers and sellers is incredible. I love how it shows who is dominating the market in real-time, which helps me make informed decisions quickly.
Whether it's spotting a reversal or riding the momentum, this indicator has been a game-changer for my scalping strategy. The visual cues are straightforward to understand, and the ability to adjust settings based on different trading sessions is a significant advantage. If you're serious about trading and want that extra edge, this indicator is a must-have. Big shoutout to BOF Admin support and the team for making charts so easy to use and keeping NinjaTrader with BOF indicators super fast and responsive! Your work has truly made a difference in my trading experience. Thanks a ton!
DM me on Discord for any questions. and see my results.
Dan Alec
Verified user
Feel the Difference
I am a trader with over 6 years of experience trading volume indicators on NinjaTrader. Other third-party vendors that sell indicators for NinjaTrader are known for their poor quality and the difficulty of using their indicators, which can cause charts to become slow and sluggish.
I no longer use any other third-party indicators, except BestOrderFlow (BOF). BOF indicators are made professionally, and you can instantly feel the difference.
Charts with BOF indicators run much faster and never freeze.
BOF has several simplifications over its competitor's footprint, which I appreciate. It is not only lightweight, but it just works flawlessly.
BOF tutorials and educational videos are very informative and helpful.
Regarding charts with BOF indicators, I appreciate how the information is organized and visually presented on the indicators.
Welcome to connect with me on Discord.
Momentum trader
Verified user
Unparalleled Quality and Speed
I have been testing BOF indicators for two months and getting shocking results. I am thrilled and excited as never before to trade. I am honest and have no financial incentives to influence my expression.
This Footprint is incredible. This Footprint indicator uniquely combines several other indicators, offering unparalleled quality and speed.
It's a testament to the programmer's expertise behind it, and I hold it in high regard. Yes, I am deadly serious in my feedback on using these indicators.
My primary motivation for writing about BOF indicators is my sincere desire to help traders grow their accounts faster. I have tested and used many indicators from other well-known brands and found that BOF indicators perform more efficiently, providing a significant advantage in trading.
Ed Garcia. 2025
Verified user.
My favorite indicators
I fell in love with BOF indicators from the very first day of use, and I highly recommend them to any trader.
I traded the S&P 500 and Nasdaq for 4 years and used BestOrderFlow indicators for 12 months.
Through the use of BOF indicators, I achieved a significant improvement in my trading results.
The visual presentation of the complex data provided by bestorderflow indicators helped me to make my entries and exits much faster and safer than ever before.
Charts with BOF indicators run much faster and are very informative. In my day trading, I use BOF Footprint, Market Speed, Delta Profile, Pulling and Staking on Dom, Heatmap on the past Dom.
I use BOF video tutorials and PDF manuals to set up each indicator the way I need for my trading setups.
Please feel free to contact me if you have any questions.
Mega Sale
New Summer Prices
The summer mega sale included better prices and subscription periods, with instant savings for longer terms.
Now you can buy every single pack of indicator or a combination of packs, resulting in 20%-33% instant savings when you combine one or more packs.
Advantage
Premium Quality
- Fully Integrated indicators
Level 1+ Level 2 + Level 3 data - Speed tested on high ATR and extreme volatility:
Footprint, Heatmap, PastDom, MBO DOM, MBO Icebergs - Compatibility performance:
All indicators run on the same chart without interference and delay. - Optimized for high-speed automation and HFT trading
Contact and Support
- FREE Support only if you qualifyed users
- Paid Support for discqualifyed users
Learn here How to Qualify or Disqualify for FREE support
Contact for general questions:
Monday-Friday 8 AM - 5 PM Pacific Time
Connect on Discord link Connect on Telegram link
We are off for the weekend: Saturday and Sunday - off.
SUPPORT CHANEL:
Support provided only with Direct messaging with BOF Admon on the Discord here: Discord: https://discord.gg/2CJAuQ87GY
Please do not use Telegram for support.
Got problems and need additional support?
Did you try to fix your problem on your own before seeking help?
Our How To User Guide is a comprehensive collection of solutions for almost any issue or problem you may encounter. Try to solve them on your own before addressing them with BOF Admin.
GET SUPPORT PROPERLY:
Before contacting our support with any issue or problem,
Please follow the How To User Guide links with solutions for:
- Requirements for the NinjaTrader platform
- Requirements for a PC computer
- Requirements for Time Synchronization
- Requirements for Internet Connection
- Solutions for your account on this website
- Solution for Machine ID and activation
- Solution for BOF indicators installation
- How to Uninstall , Remove or Delete BOF indicators
- Troubleshooting checklist
- Errors on NinjaTrader
Request support and assistance from BOF Administrator only after you have gone through:
- Troubleshooting checklistTroubleshooting checklist
- Preparation for getting support checklist Preparation for getting support checklist
The first question you're going to get from the BOF Administrator is:
Did you review the Preparation for Support Checklist and the Troubleshooting checklistTroubleshooting checklist
Contact with general questions about BestOrderFlow Indicators:
Connect on Discord link Connect on Telegram link
Join our Discord community of traders practicing BestOrderFlow indicators technologies:
Reasons to join our community:
- See real results by community members
- Get direct support from the BOF Administrator
- Attend Live Support Q and A on webinars every Monday at 7:00 PM Eastern Time, 4:00 PM Pacific Time
- Download Manuals and user guides for indicators
- Download ready-to-use templates
- Learn Trading strategies.
- Community of traders
The main difference
Our main product is not indicators. Our main product is the speed and performance of indicators. For Example:
- Our new Smart Trade indicator includes "Big Trades" with substantial improvements:
- We improved Big Trades detection using MBO Data and Order IDs. We detect Single Big Trades more accurately than any other Big Trade indicator.
- We also detect High-Frequency Trades with incredible precision using order IDs.
- Now you get true Big Trades zones from the start to the end of the trade. Big Trades Zones provide a significantly better display of support and resistance areas.
- To avoid confusion with the simple, primitive Big Trades Indicator developed many years ago, and to reflect significant improvements made by bestorderflow.com, our Big Trade Indicator is released under the name Smart Trade Indicator. There are no other Big trades indicators in the NinjaTrader ecosystem capable of using Order IDs data for such excellent precision and accuracy in detection.
The NEW HEATMAP is our professional-grade heatmap that keeps working during critical times during a high-volatility NY open and never freezes. The NEW HEATMAP Version 2 (Expected release after May 1) is 80-100 times faster than the previous version. Welcome to test it with professional testing apps and software.
Complete Orderflow packs of Indicators:
- Pack 1 - Aggressive liquidity indicators: advanced Footprint
- Pack 3 - Passive and Aggressive liquidity NEW HEATMAP
- Pack 2 - Passive liquidity: advanced SuperDom Pulling and Stacking
- Pack 4 - Instant liquidity: Market By Order MBO Dom Pack
Most traders don't know:
If your automation is based on slow and not tested on speed indicators, it is a waste.
Build automation based on BestOrderFlow super-fast indicators to outperform:
- Bots,
- Algos,
- High Frequency Trading, NinjaTrader Strategy
- Automation built with BOF indicators outperforms automation built with any other "Lego" type of software for NinjaTrader. ( pending access to data for automation)
We are no longer naming our Package 3 as LEDGER . Our new name for Package 3 is NEW HEATMAP