PAST DOM INDICATOR (part of PACK 2):
What is the Past Dom?
Past Dom is the historical order from the Live Dom. Live Dom is the orders in a moment, Past Dom - the same order's history in the past.
Past dom displays orders, time, and total volume.
- Time: the history of time spent waiting at the price level. Some orders devote time to the price level until they are executed. Some orders move away when the price line approaches them.
- Volume: the amount of volume in orders at any given moment at the price level.
History of the level 2 orders displayed as a Heatmap. Practically, PastDom is the Heatmap.
Heatmap
1) Heatmap colors: The heatmap visually separates bids and asks by color.
Bid - seller resting orders colored red. Ask - buyers' resting orders are colored green.
2) Heatmap heat:
In the Past Dom Heatmap, shades of colors represent the intensity and size of a value, with darker colors representing lower volumes and brighter colors representing higher volumes.
This visual representation enables the quick and efficient identification of areas with high and low liquidity concentration. Hovering over any area on a heat map displays volume in the tooltip.
PULLING AND STACKING DELTA
PULLING and STACKING DELTA refers to the difference in the pressure of liquidity.
Pulling and stacking Delta is a horizontal indicator at the bottom of the chart, displaying vertical bars that show the difference between pulling and stacking for each candle bar. Settings for Pulling and Stacking Delta are inside the Past Dom indicator.
PACK 2 TRADING STRATEGIES:
Strategies based on Level 2 indicators that include Live Dom, Past Dom, delta 2, Pulling and Stacking , Big Trades
PAST DOM VIDEO + PDF MANUAL
Manuals / Instructions / Explainer about how to set up Footprint:
How to set up the Live Dom indicator
VIDEO + PDF MANUALS AND INSTRUCTIONS
Manuals / Instructions / Explainer about how to set up Footprint:
1) Download PDF Live Dom Manual ![]()
2) Download PDF Past Dom Manual ![]() 3) Download Big Trades PDF Manual
3) Download Big Trades PDF Manual ![]()
Watch video:
Live Dom Indicator explainer
Watch video: Heatmap video explainer
(part of PastDom)
Big Trades - Institutional Trades Indicator Manual
Watch Big Trades explainer video:
PACK 2 INDICATORS LINKS
(links open in a new window) :
Links for Pack 2 indicators: Passive side of orderflow:
- Live DOM :
- Delta Pulling and stacking in a Live Dom
- Total Pulling and Stacking on a live Dom,
- Past DOM (click to learn more):
- Two-color heatmap
- Delta for Pulling and Stacking (horizontal indicator above footer).
- Dom - vertical histogram for level 2 passive orders
- Big Trades indicator for NinjaTrader 8
Based on level 1 data, aggressive orders by market
Must Watch Videos: https://bestorderflow.com/userguide/videos/bof-youtube-play-lists
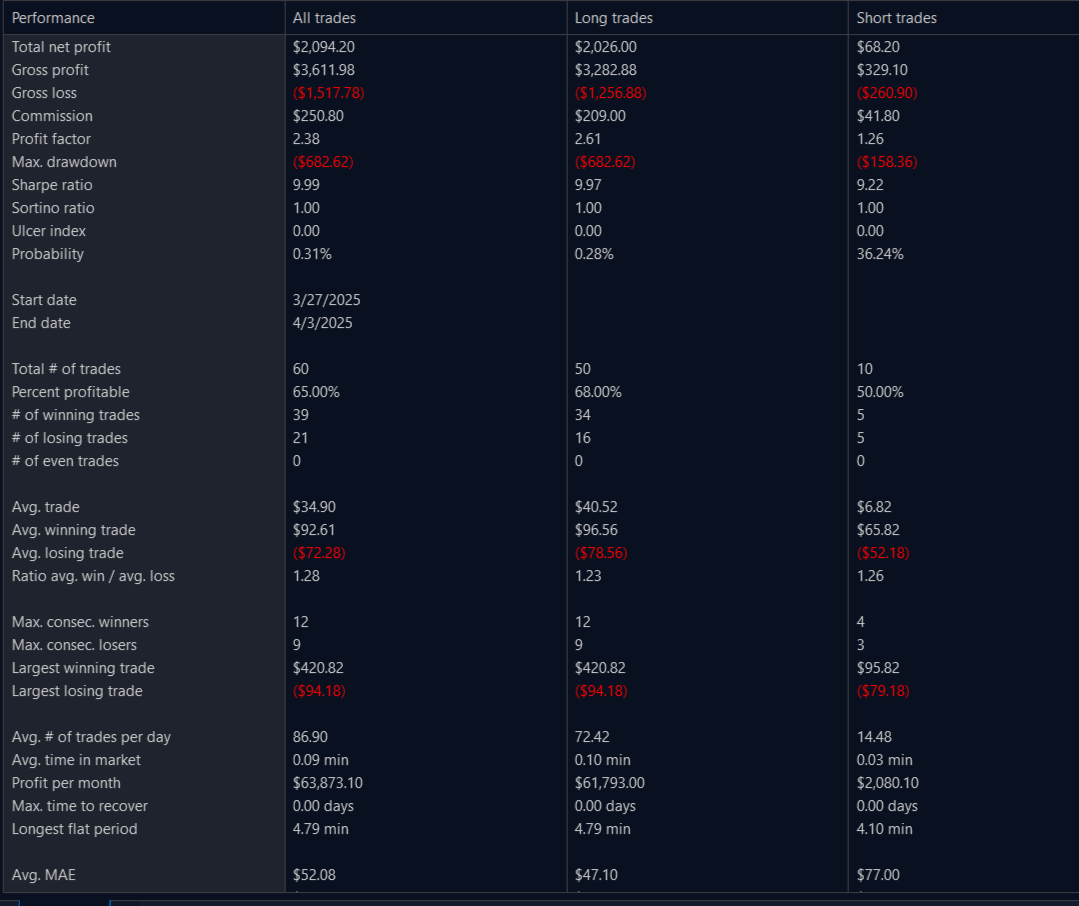
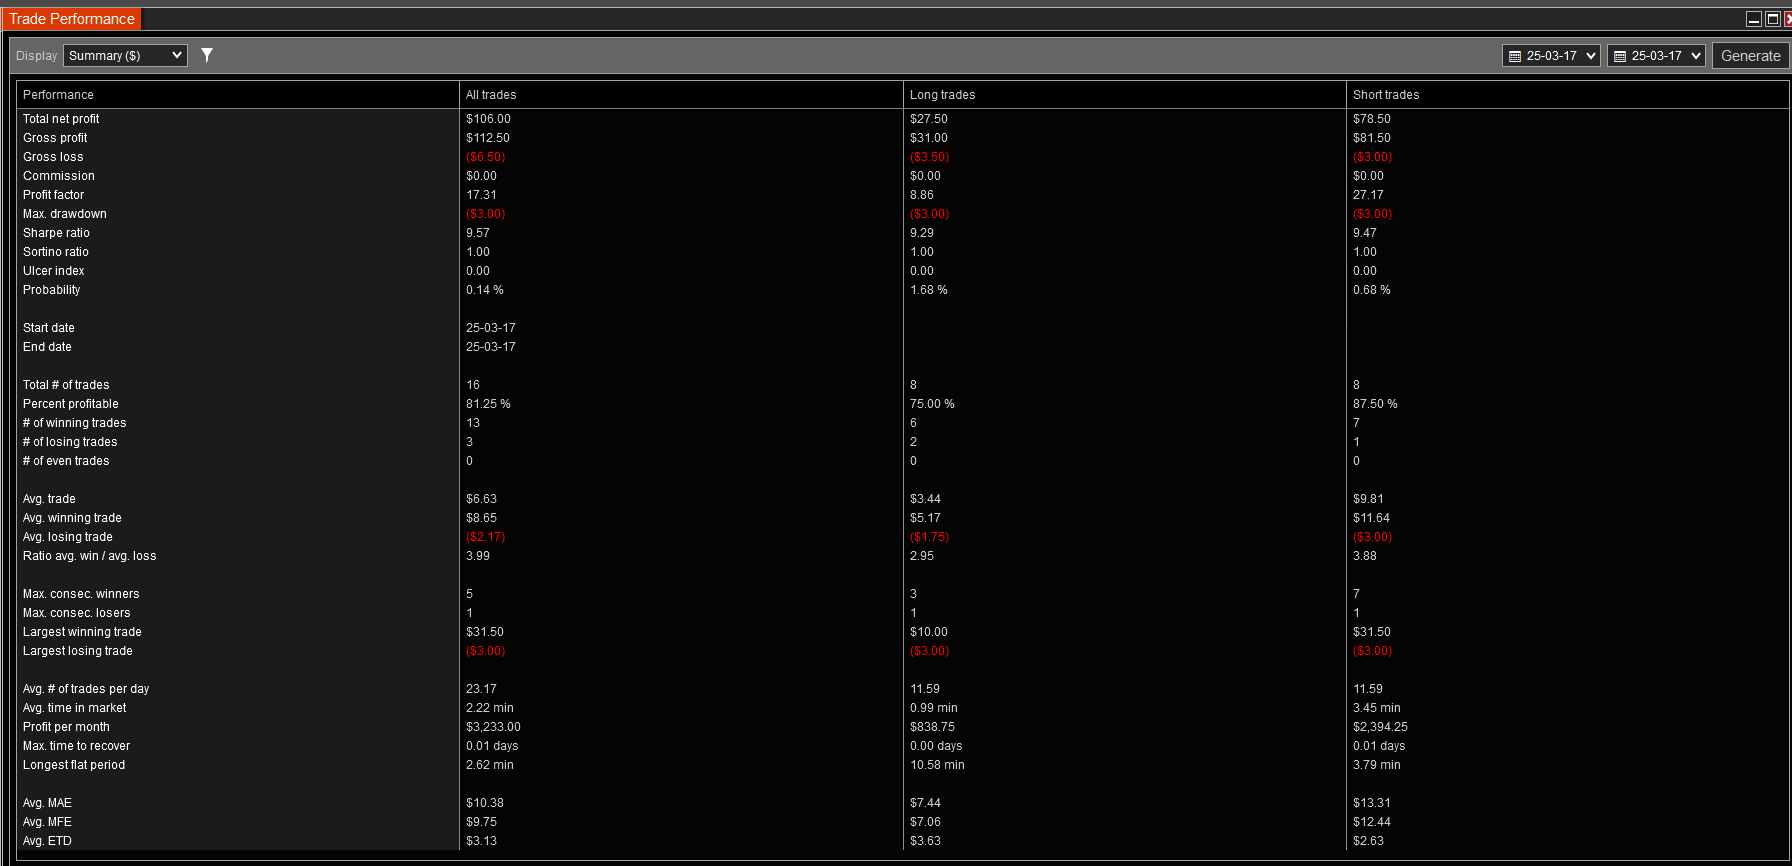
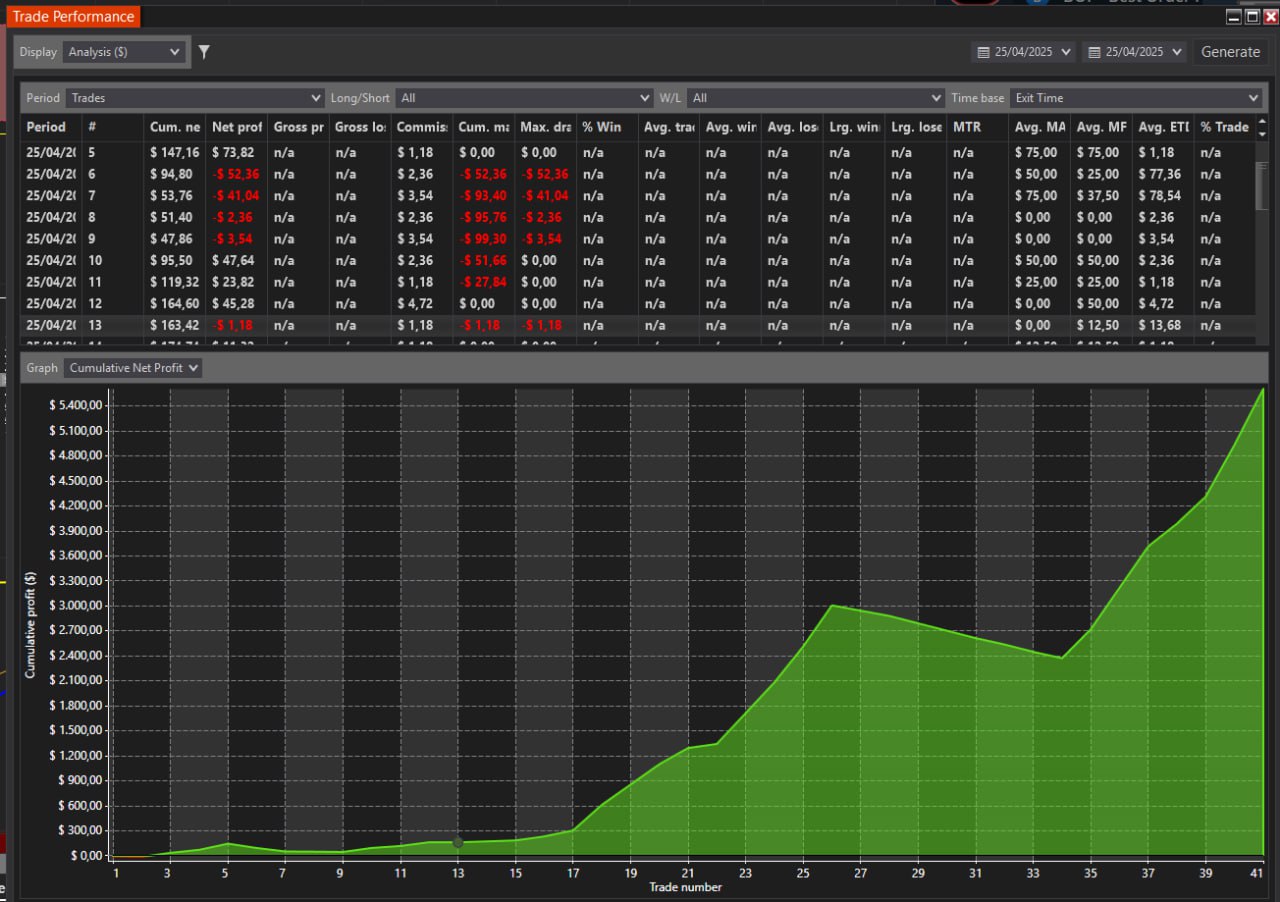
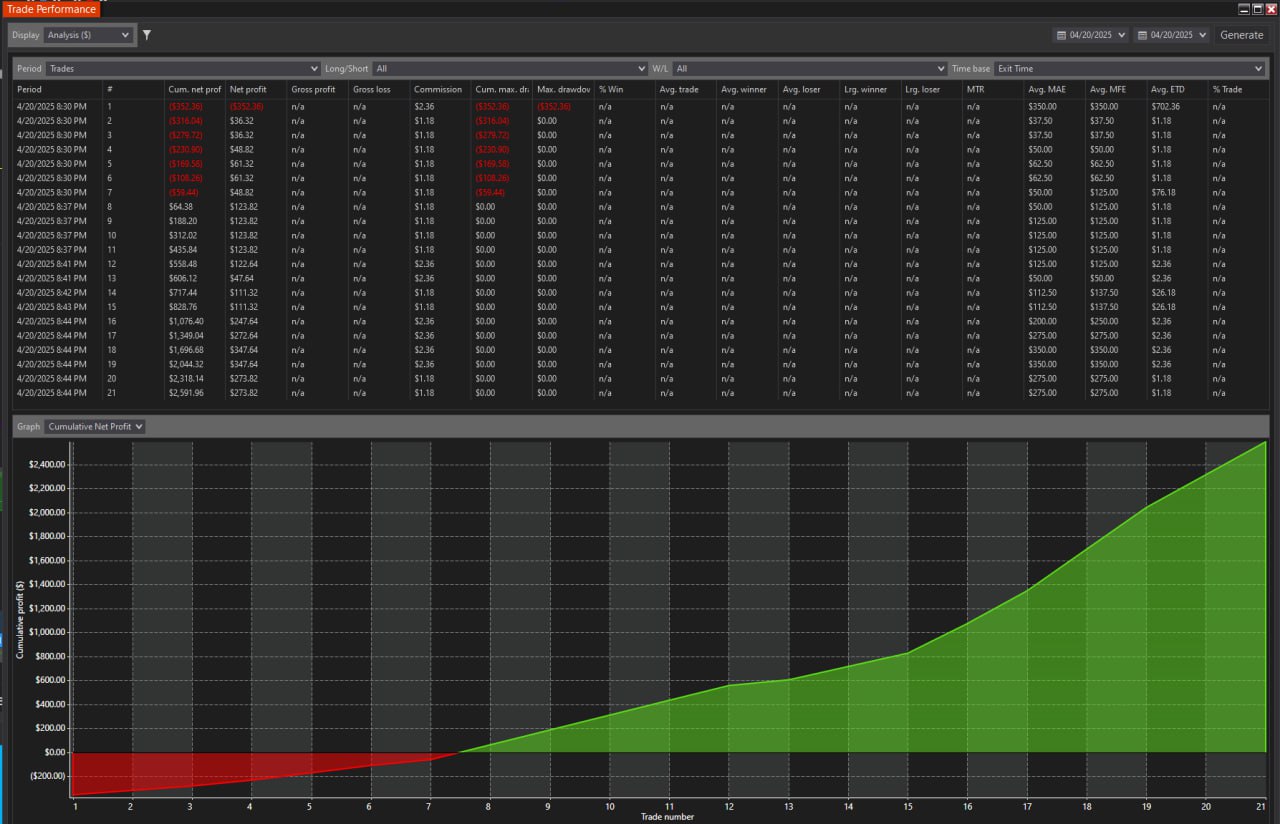
 I have passed one more funding account with Apex Trading today and made $3,000, which is the threshold for passing the account. I traded NQ, and the Bestorderflow indicators are excellent for passing props.