


Most Traders Don't Know
Why Footprint is not enough
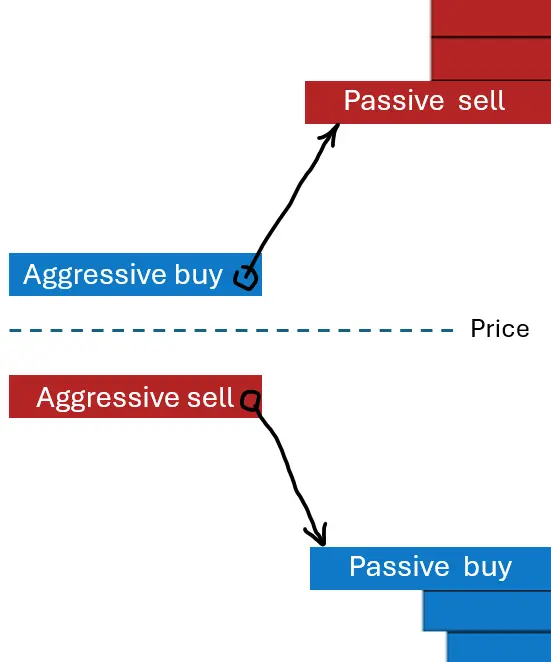
- Aggressive participants initiate a price movement with market orders.
- Aggressive orders are visible on aggressive volume indicators such as Footprint, Volume Profile, and Delta 1.
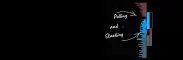
On the other hand, passive orders wait at certain price levels in advance and are visible on passive liquidity indicators such as Heatmap, Depth of Market DOM, Pulling/Staking
Passive participants:
- Provide liquidity for aggressive participants to engage in interaction.
- Position their limit orders in advance.
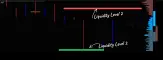
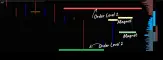
- They may defend some price levels as strong resistance and support
- Used to accumulate and distribute large orders.
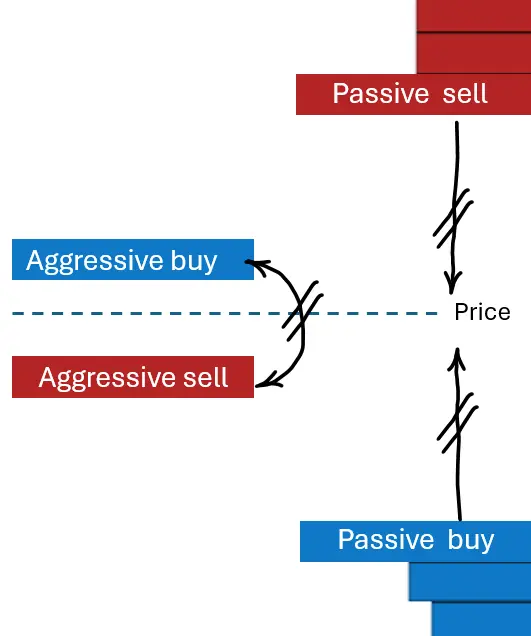
 Price Mechanics:
The key concept:
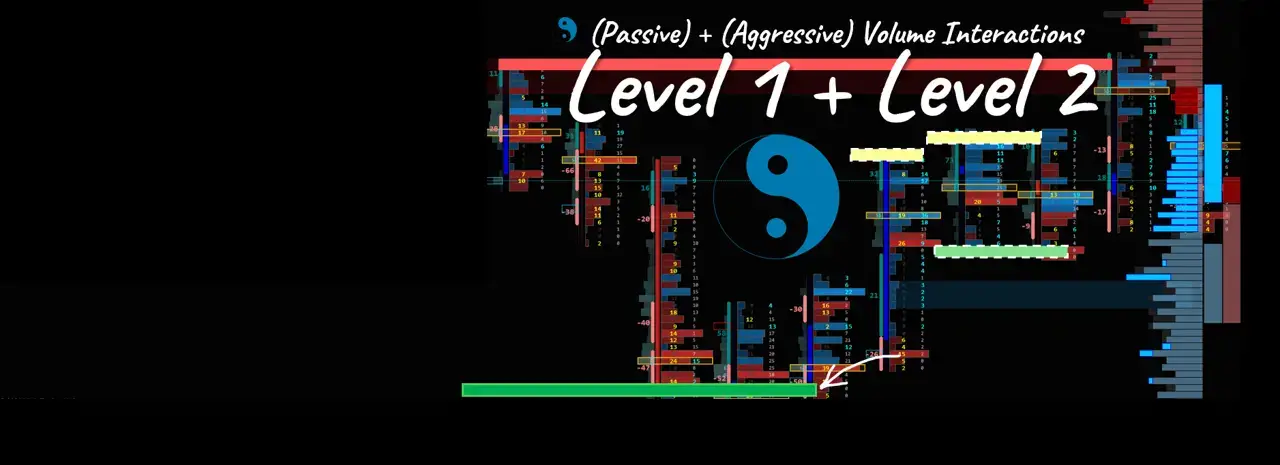
Price movement occurs due to the interaction between aggressive and passive orders.
- Passive orders provide liquidity to aggressive orders
Easy to remember:
- "Aggressive buy" market orders do not interact with "aggressive sell" market orders
- "Passive sell" orders never interact with "passive buy" orders
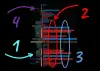
The same level orders never interact with each other:
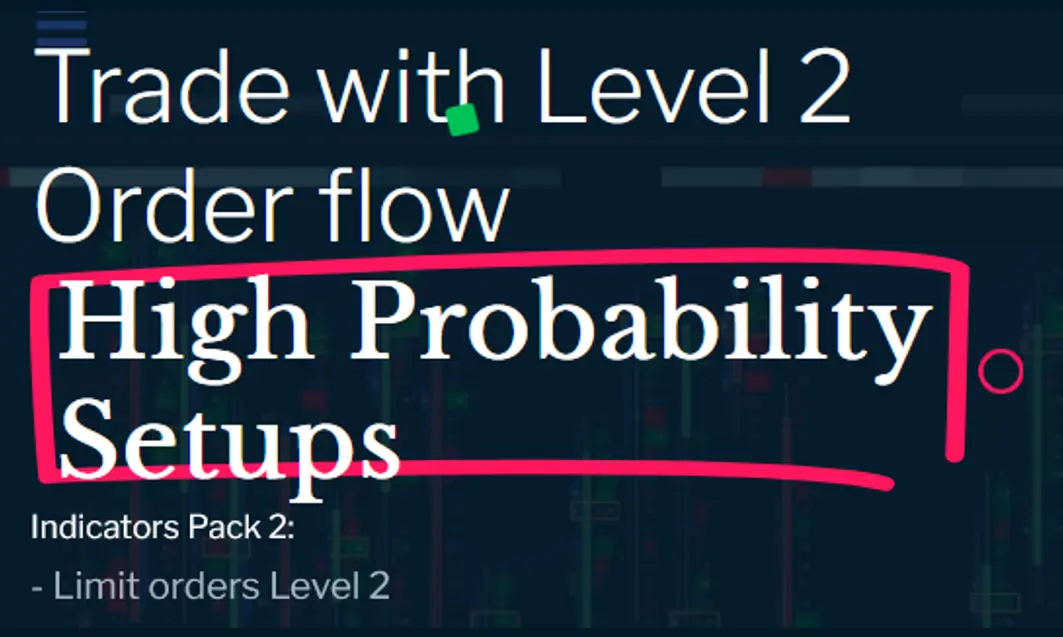
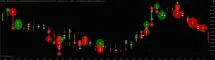
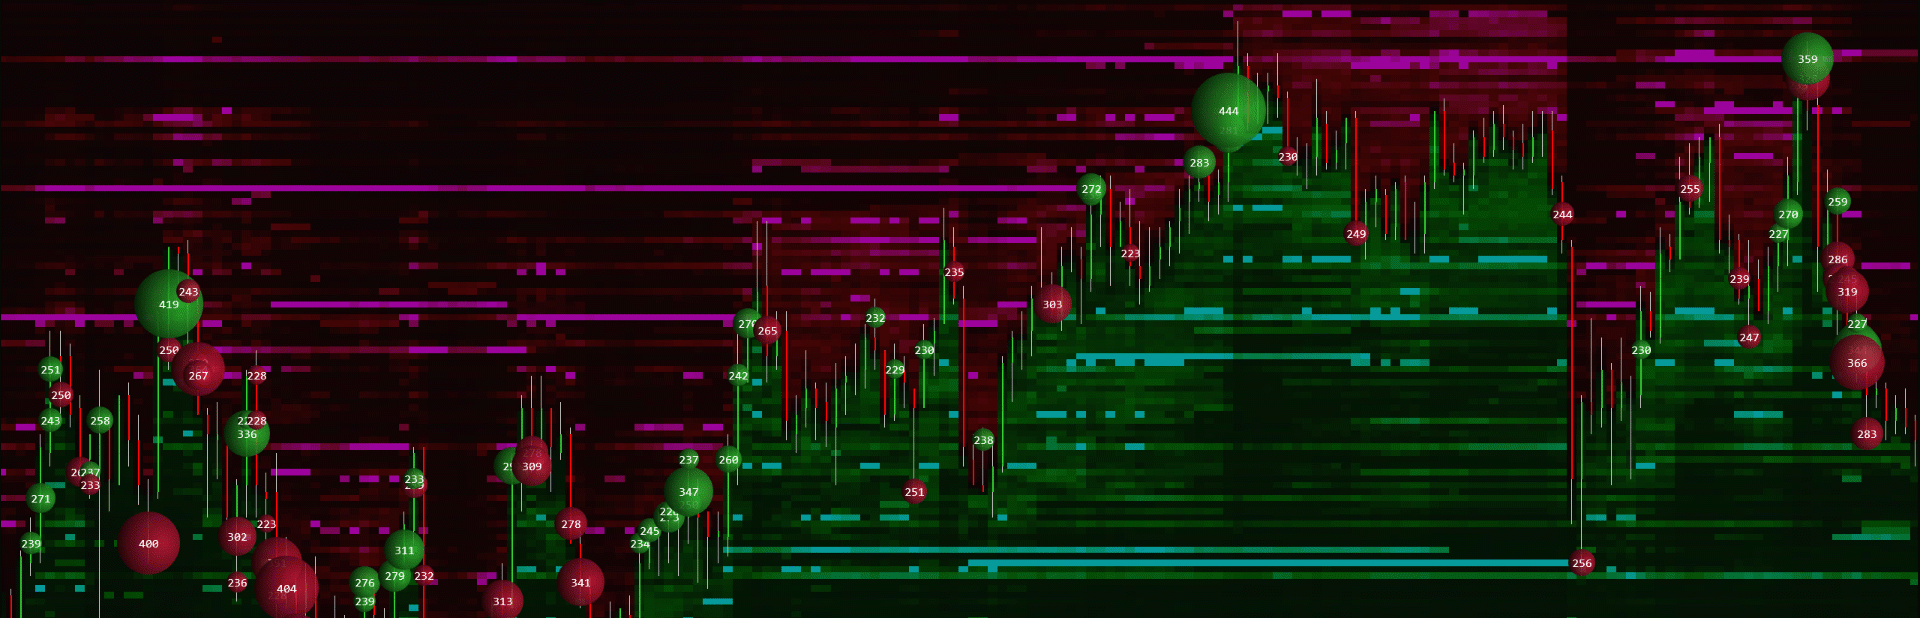
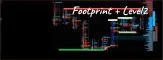
Pack 1- Aggressive Volume Indicators
Pack 1
Aggressive Orders Indicators:
Day Trading, Scalping, Micro Scalping
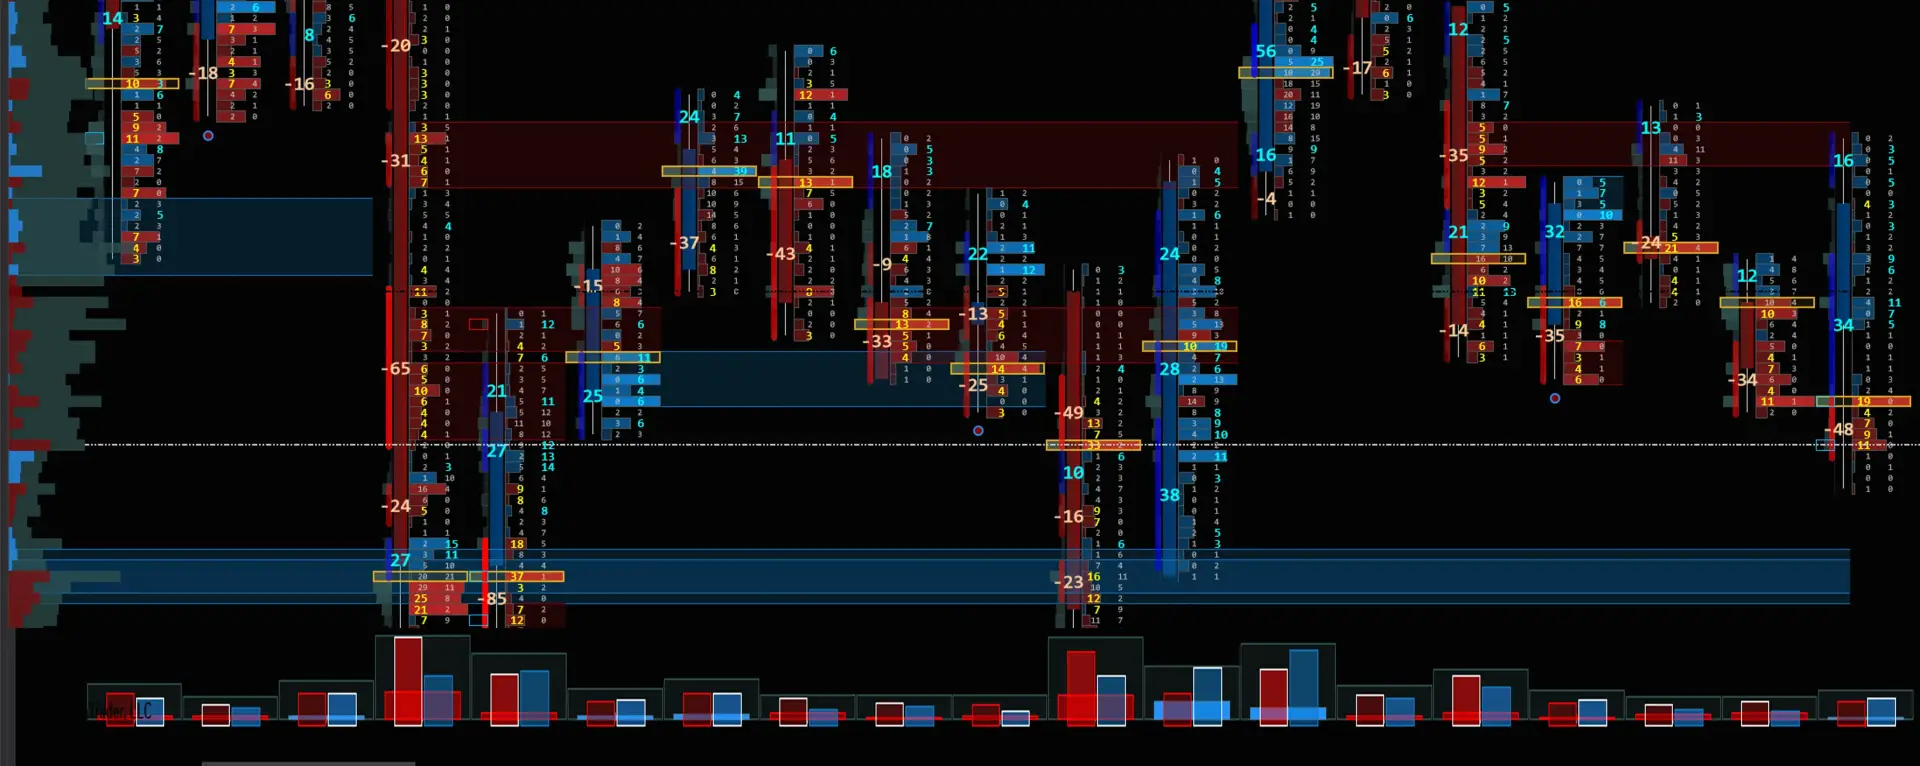
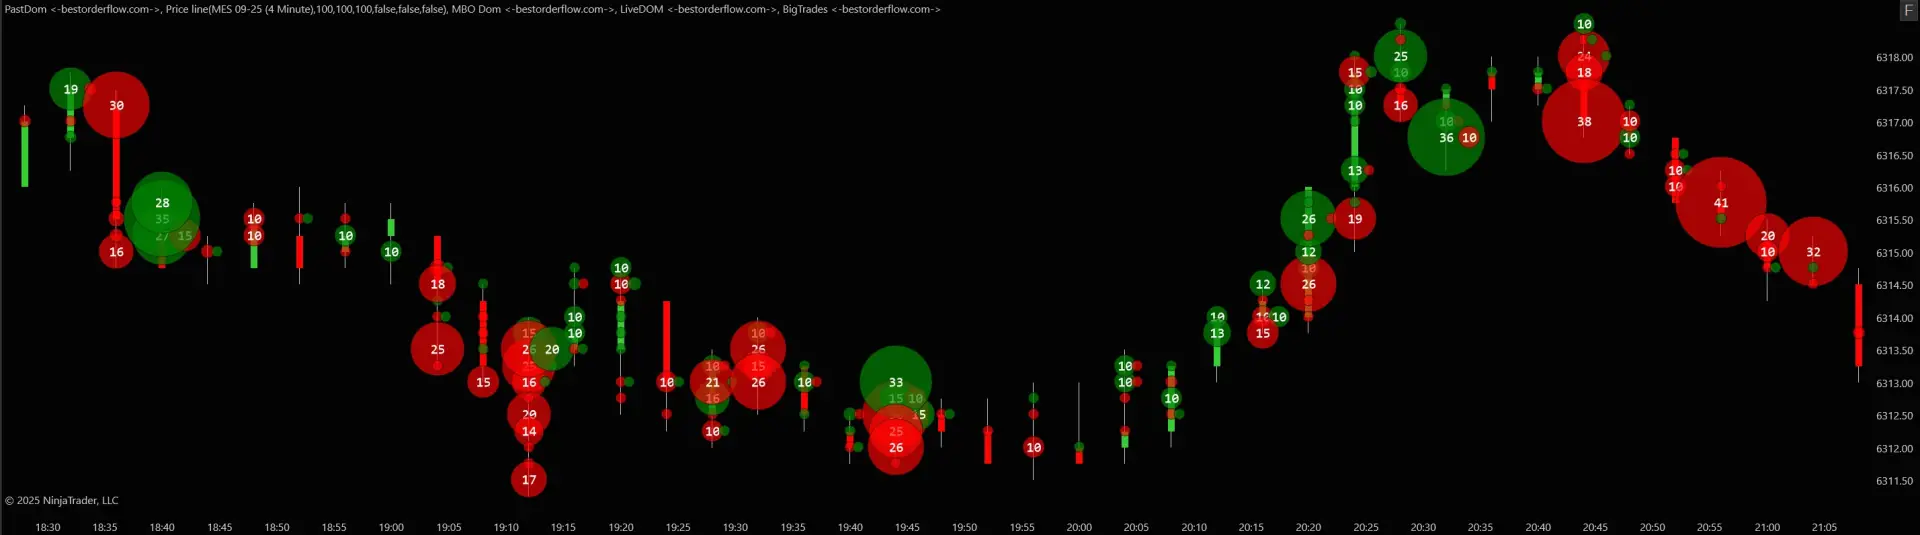
The fastest and most reliable Footprint :
- Integrated with Heatmap
- Integrated with MBO
- 4 Columns
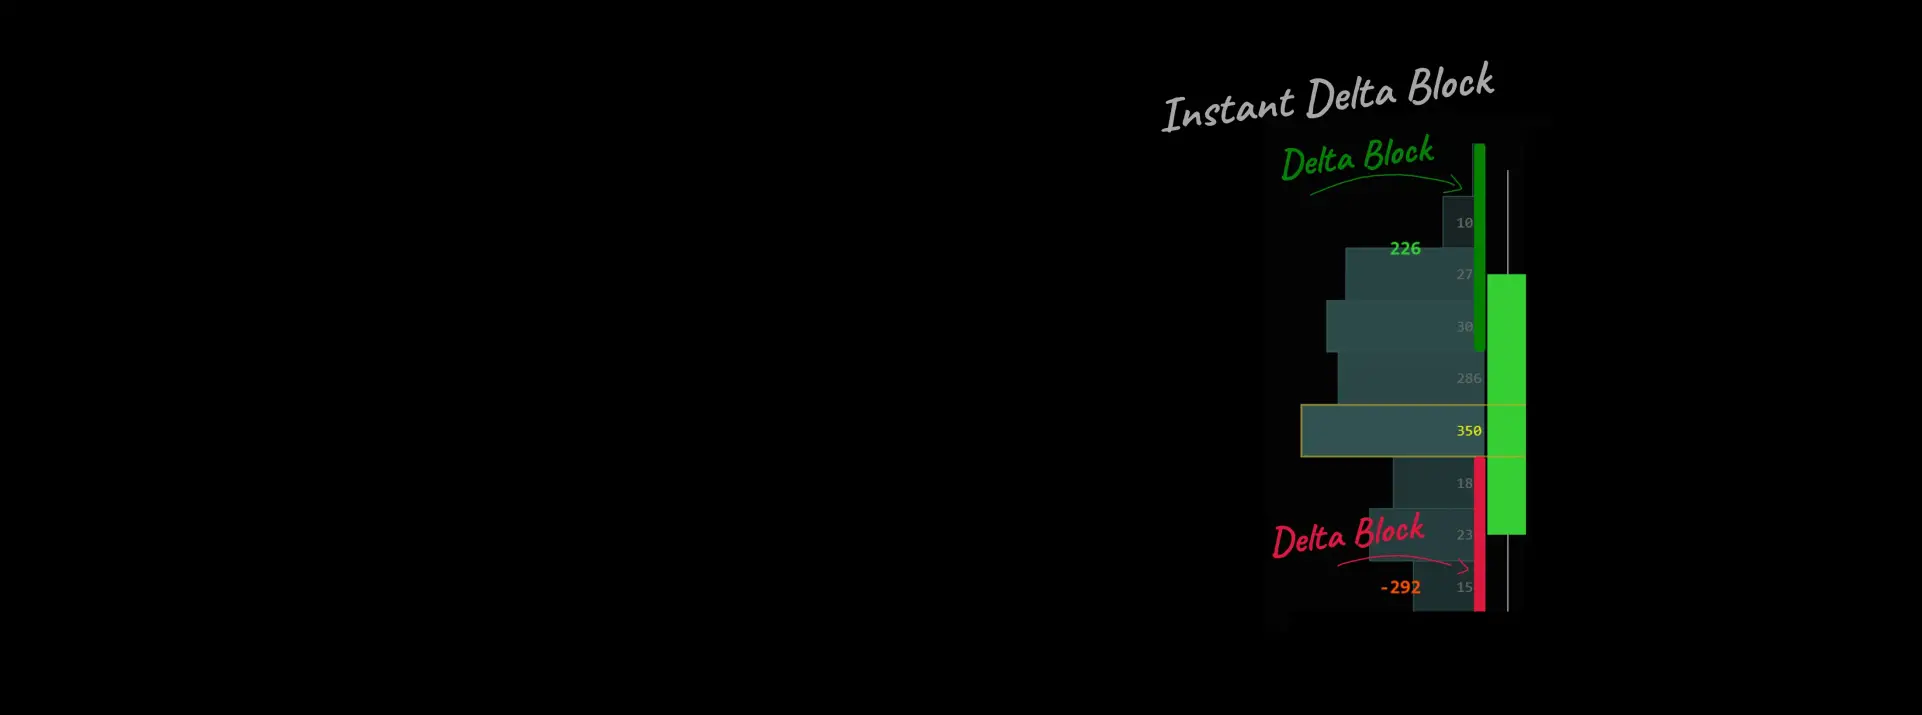
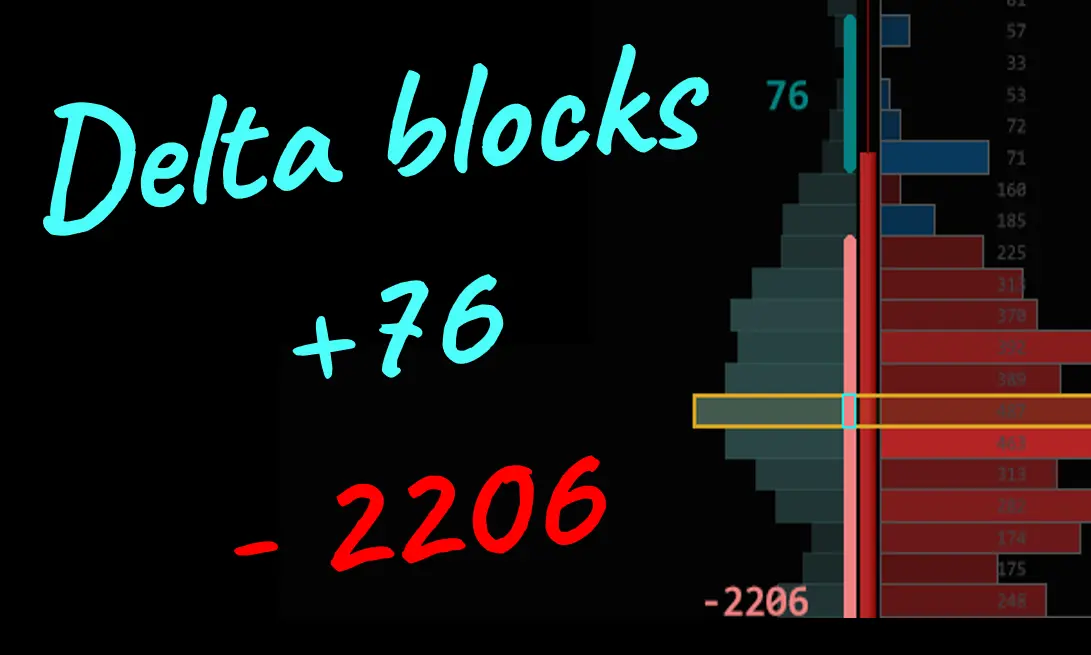
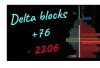
- Instant Delta Blocks
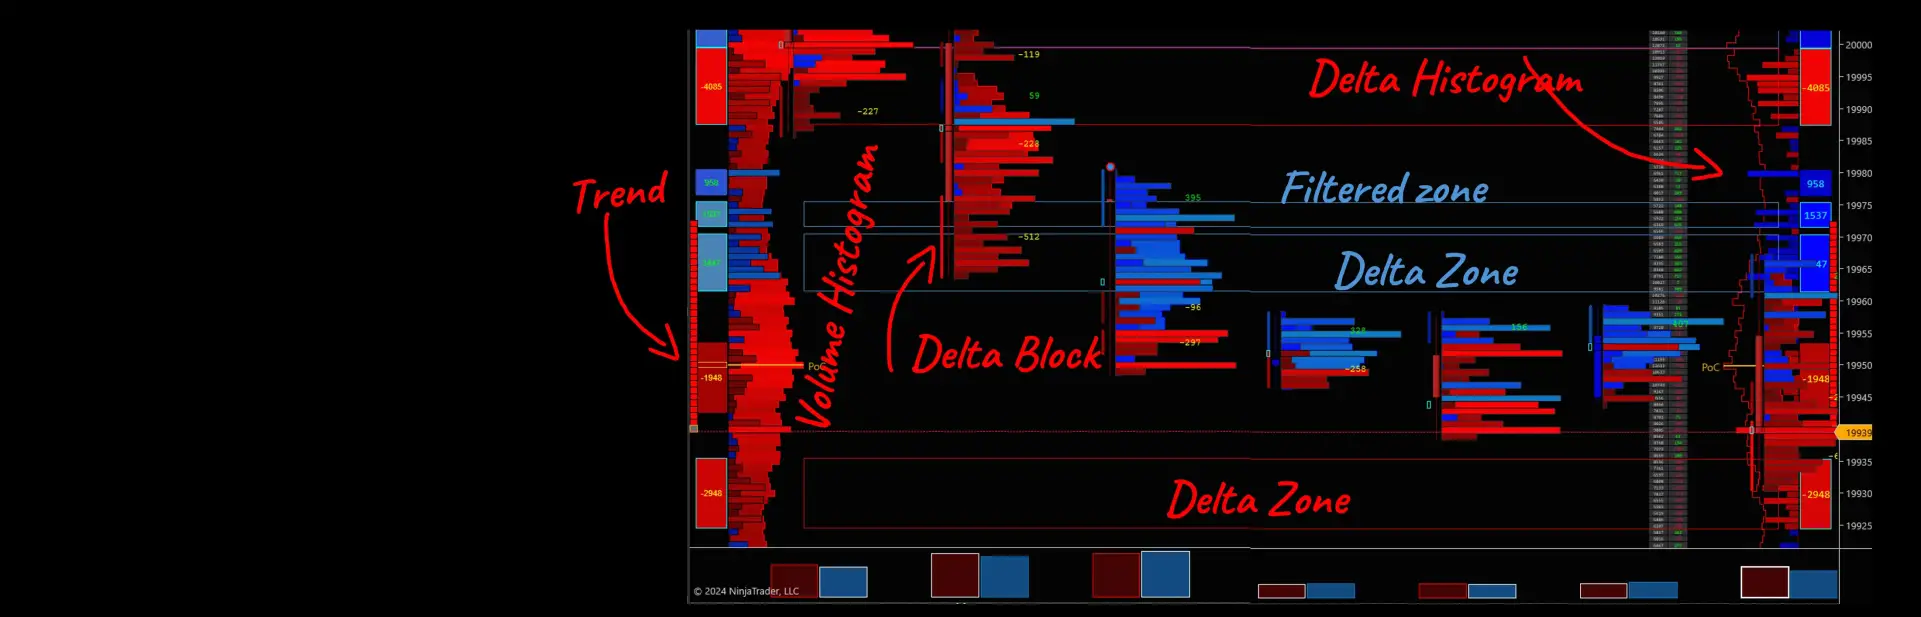
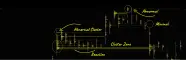
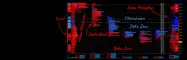
- Delta Zones
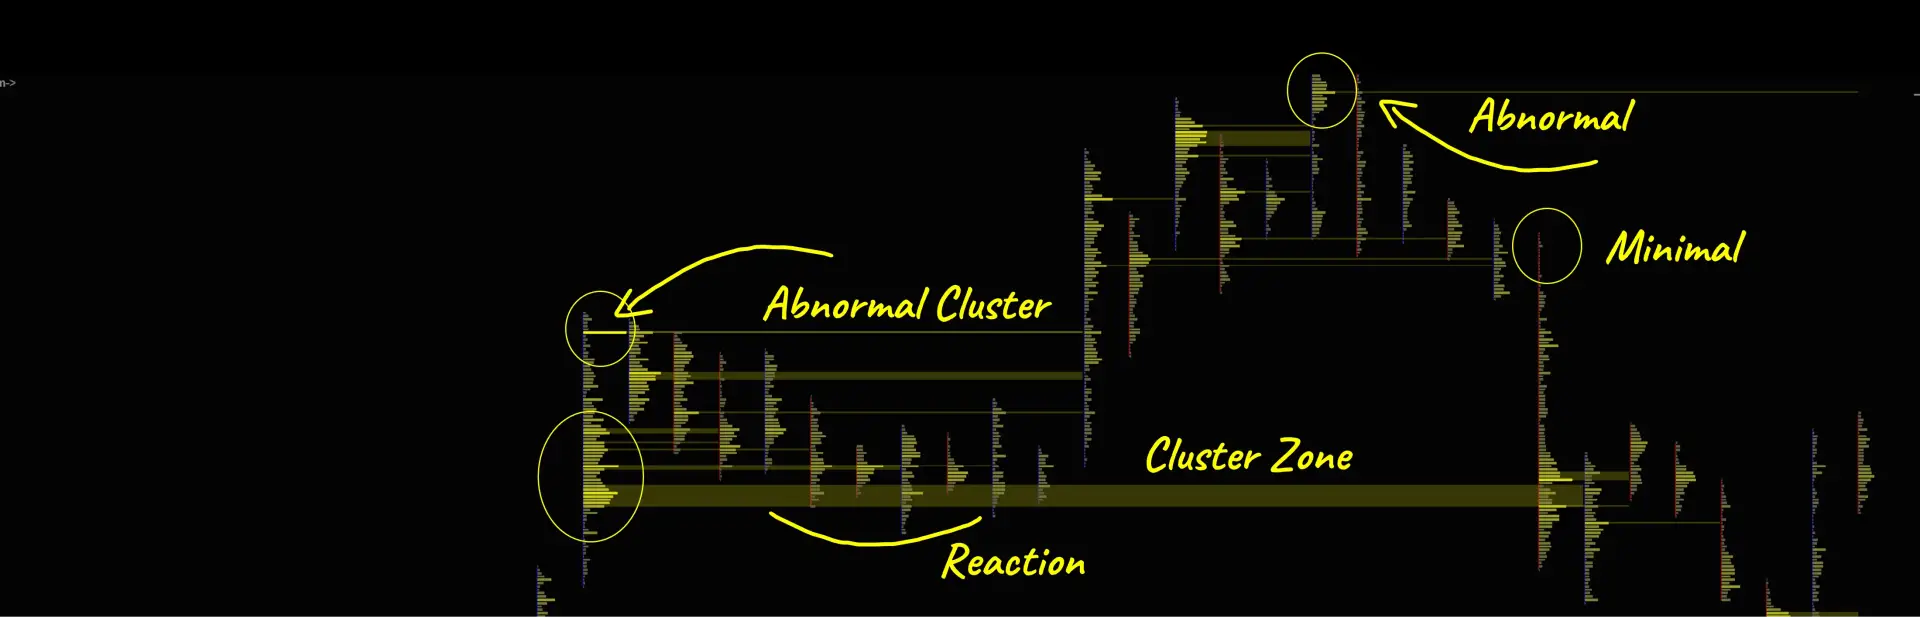
- Cluster zone
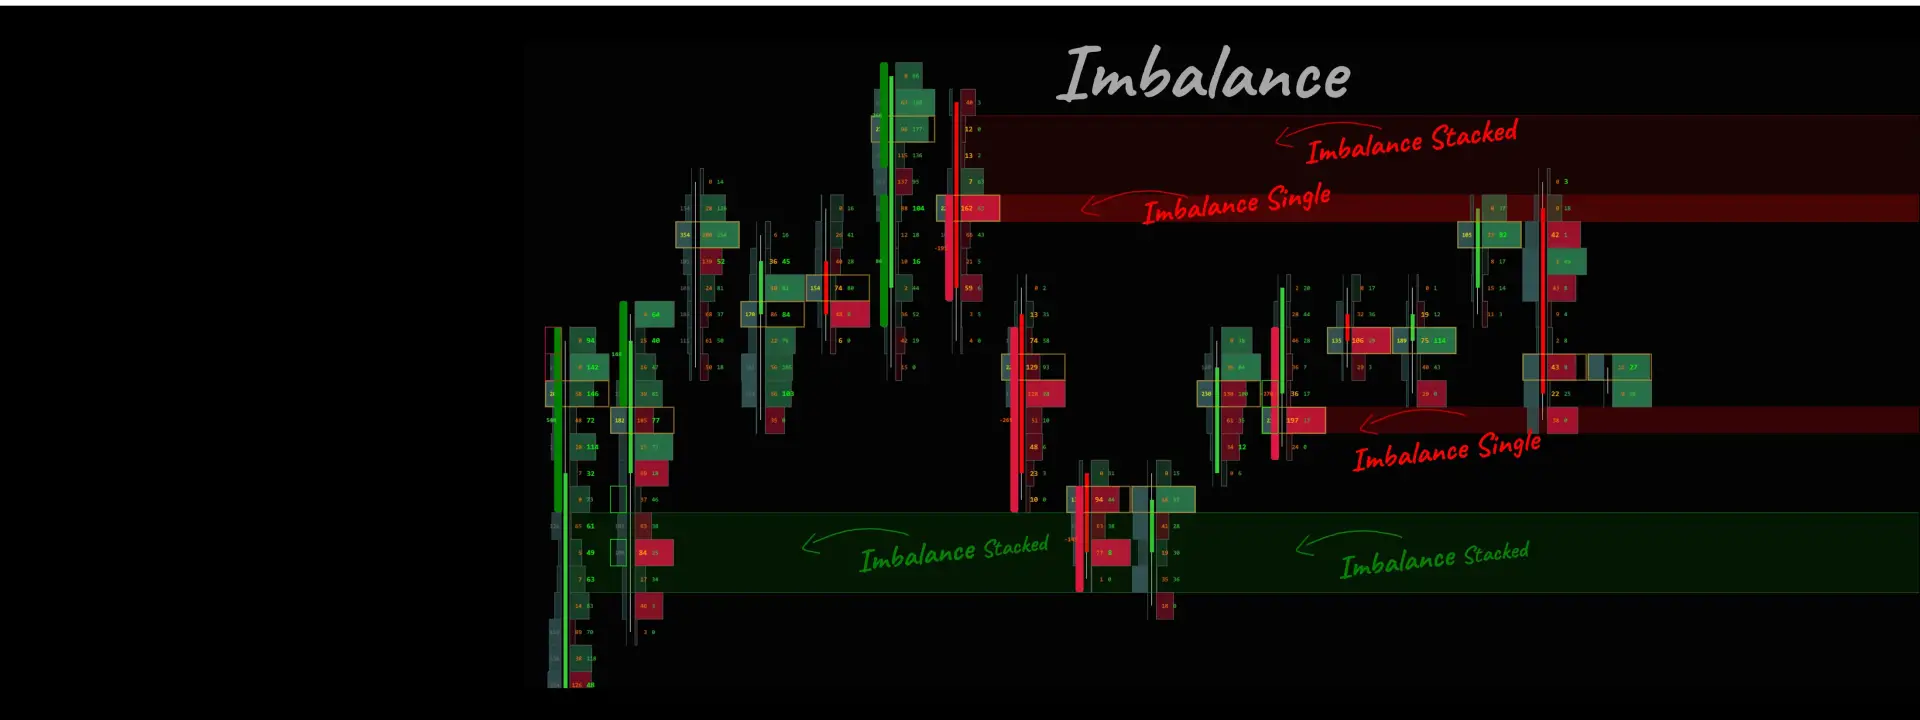
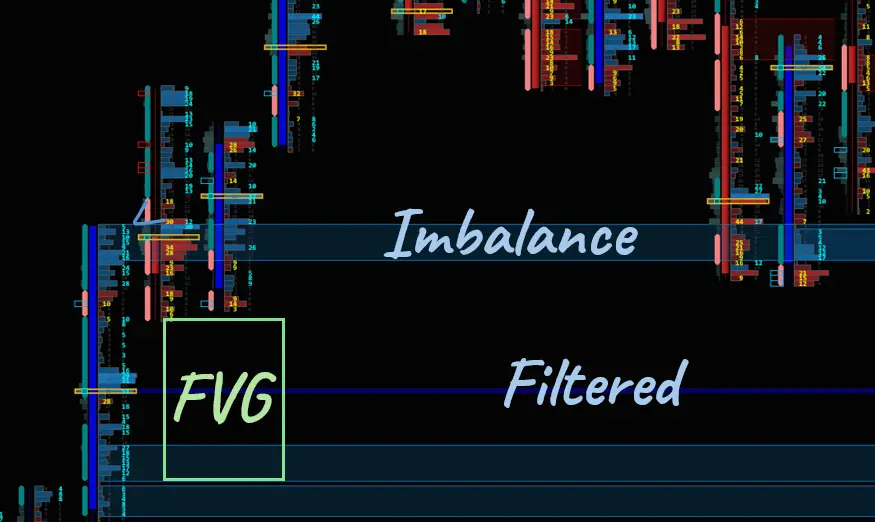
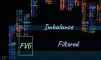
- Imbalance zone
- Delta Profile
Select style to view:


One-Sided or Complete Orderflow?
Would you prefer to trade only the Aggressive side on Level 1, the Passive side on Level 2 and 3, or a Complete Orderflow?
Aggressive Side of Order Flow
Indicators Level 1 - Top of the Book
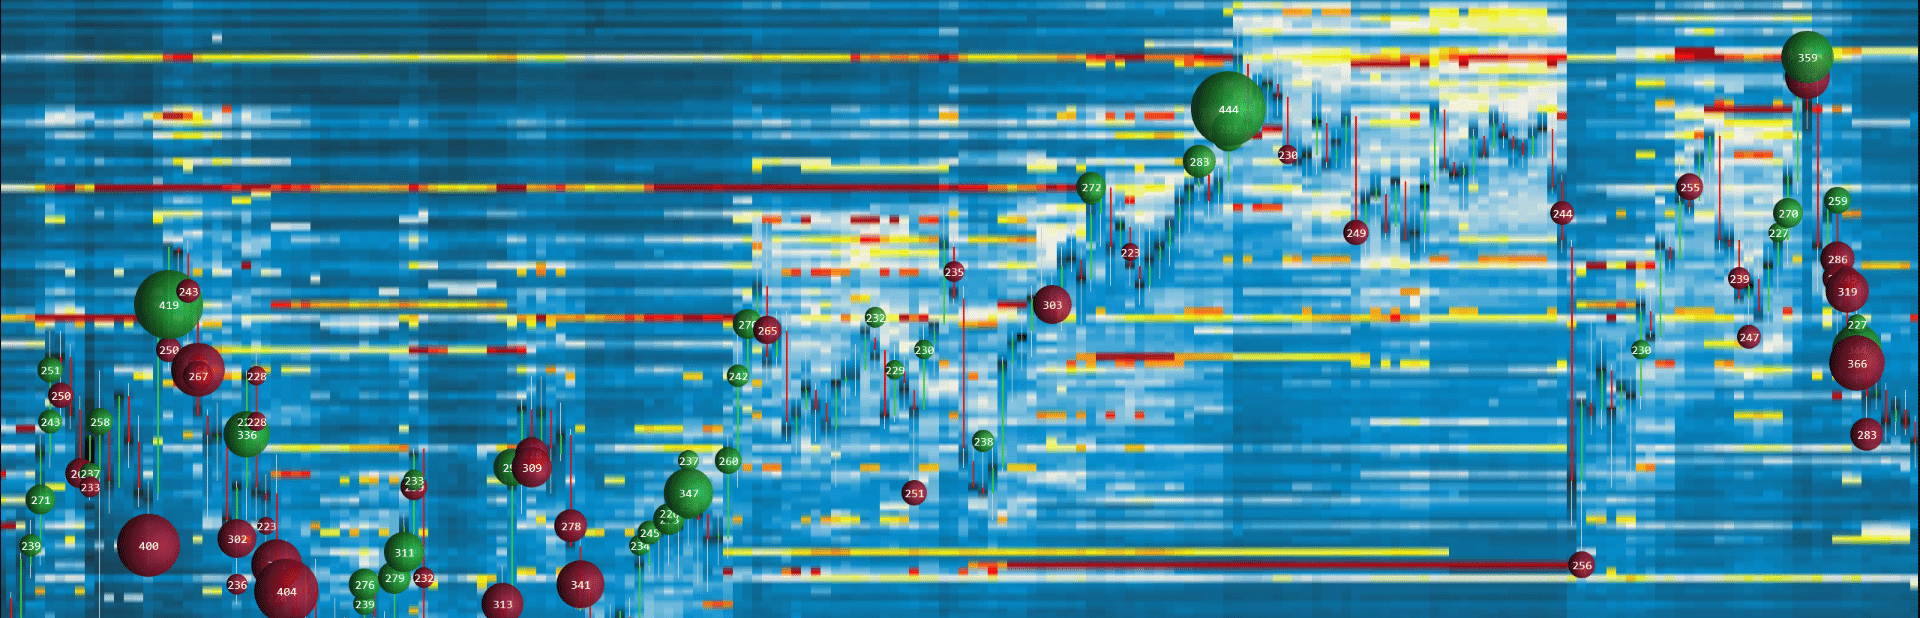
Trade with Footprint, Delta, and Volume
- Display aggressive market buyers and sellers
- Reveal imbalances and cluster zones
- Indicate trend exposition
- Trade Delta
- Trade Volume
- Trade Volume Profile
- Trade pullbacks with confidence
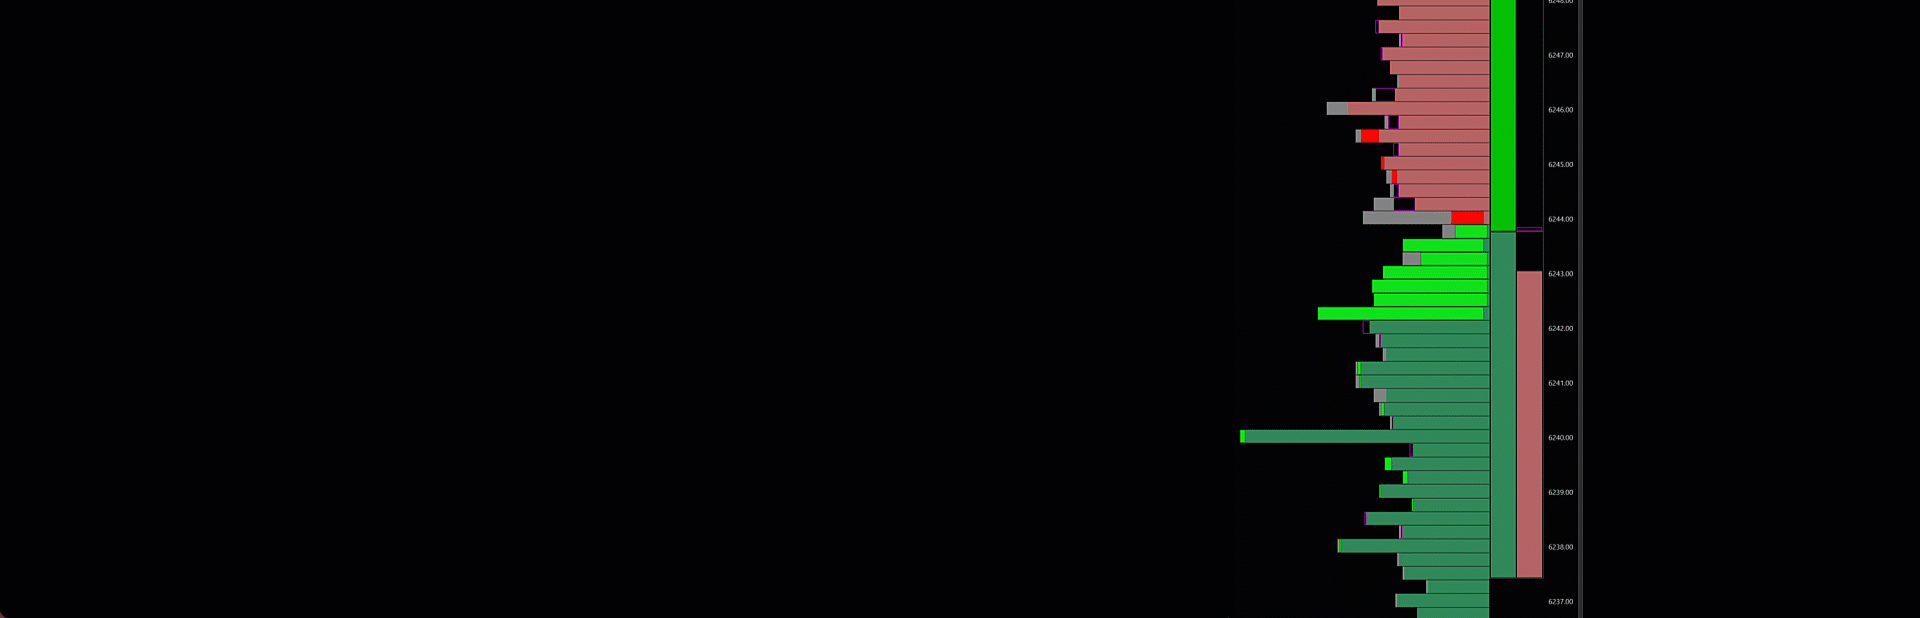
Passive Side of Order Flow:
Indicators Level 2 - Market Depth
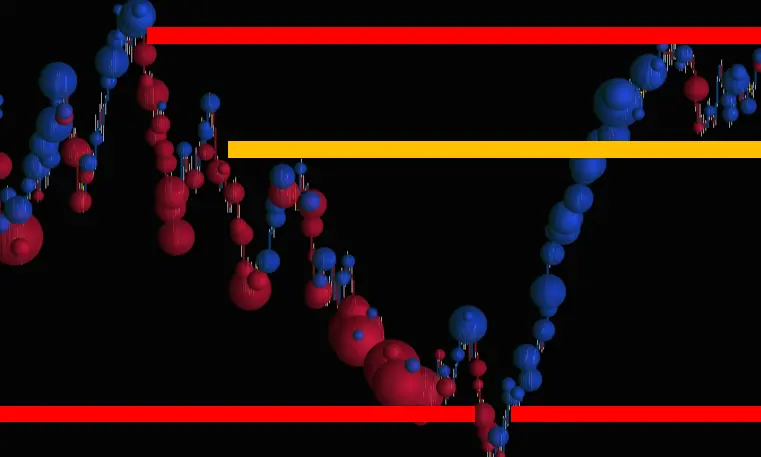
Trade with NEW HEATMAP and Depth of Market
- Spot hidden passive liquidity zones on level 2
- Predict the most potent level 2 support and resistance zones
- Spot possible trend reversals in advance
- Trade breakouts before anybody else
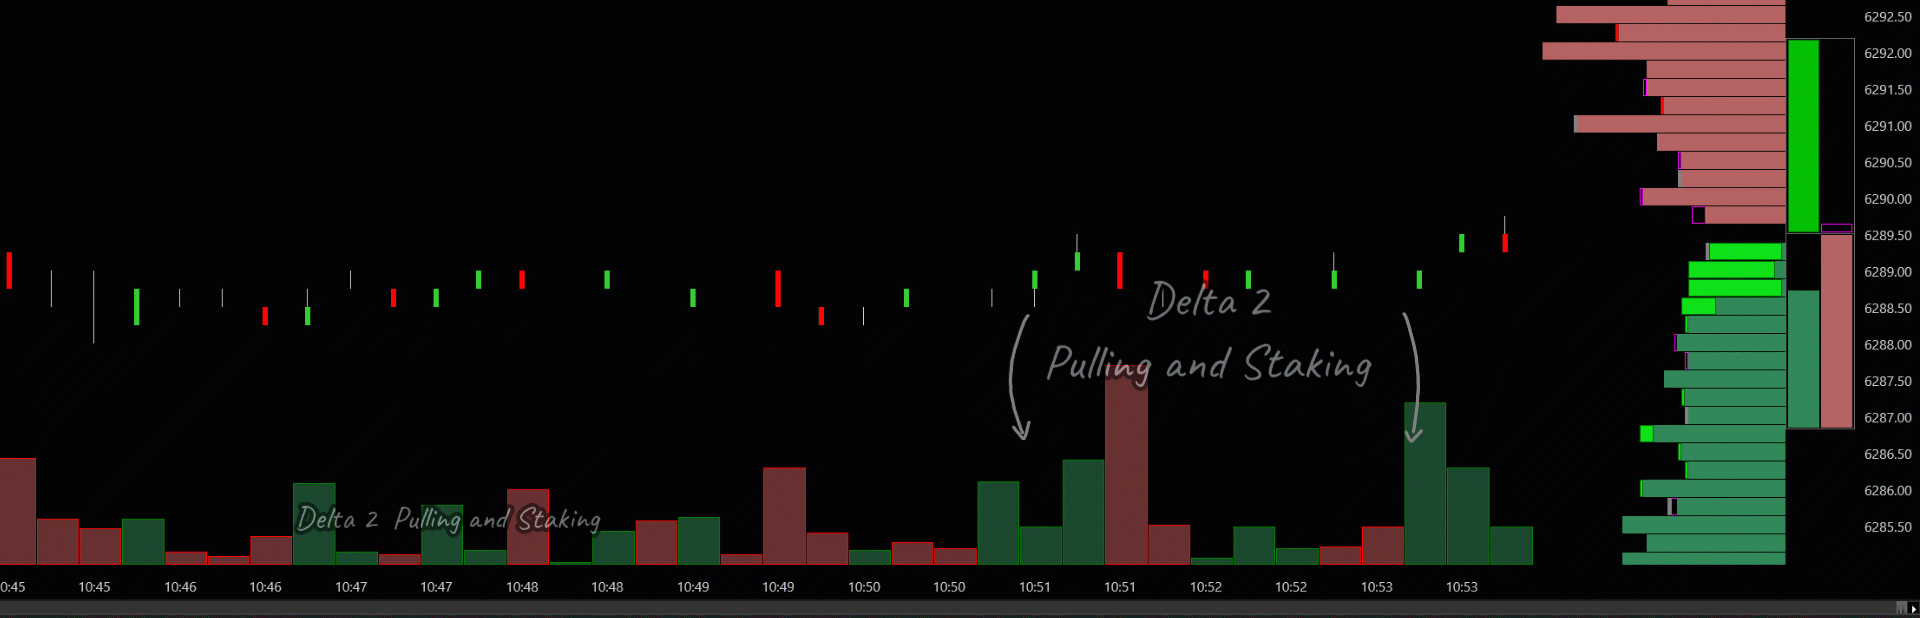
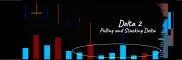
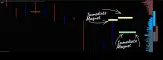
- Trade pulling and stacking
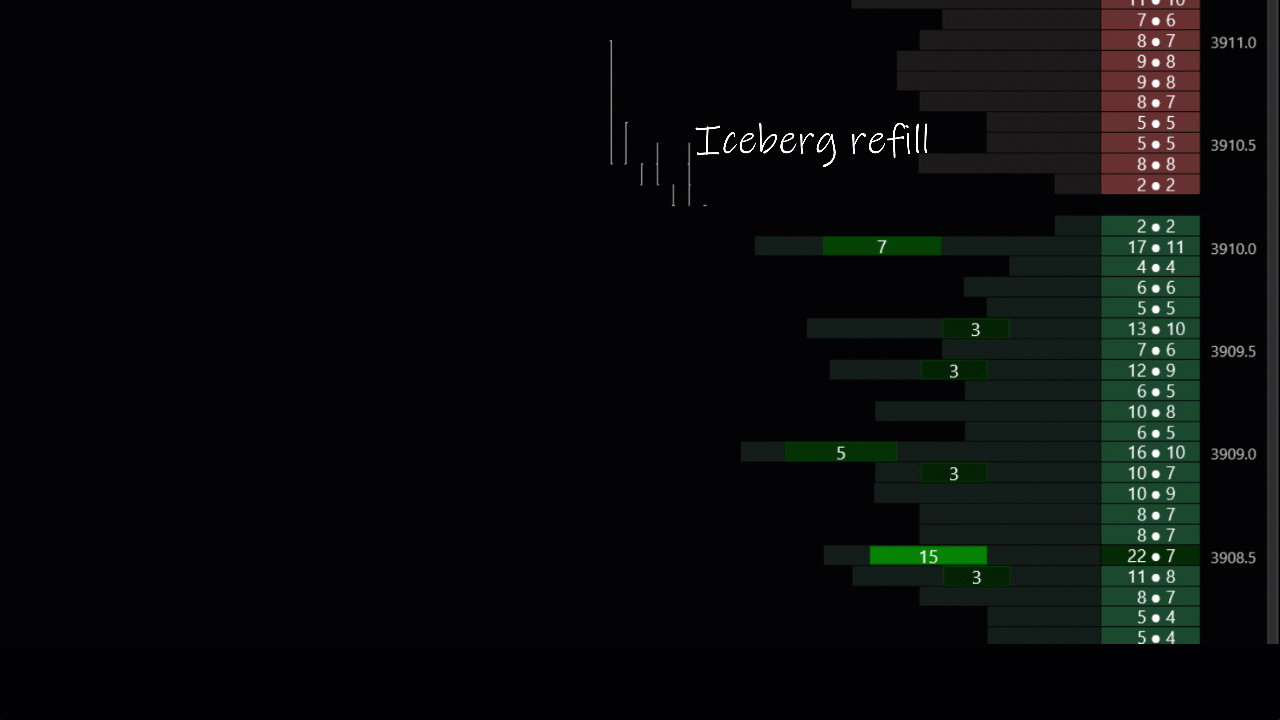
- Trade Synthetic Icebergs
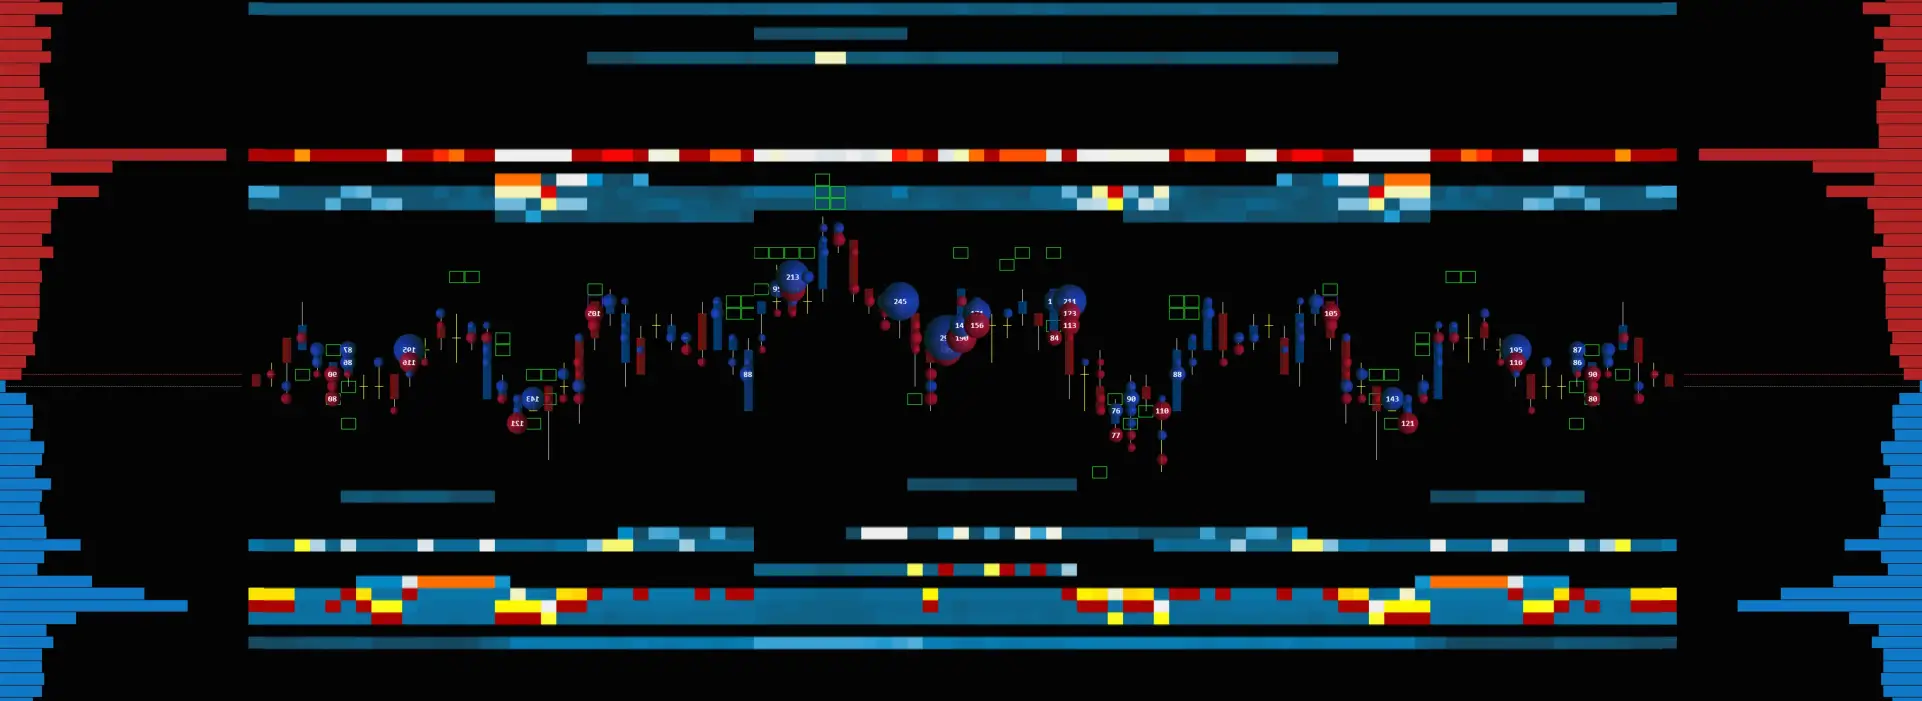
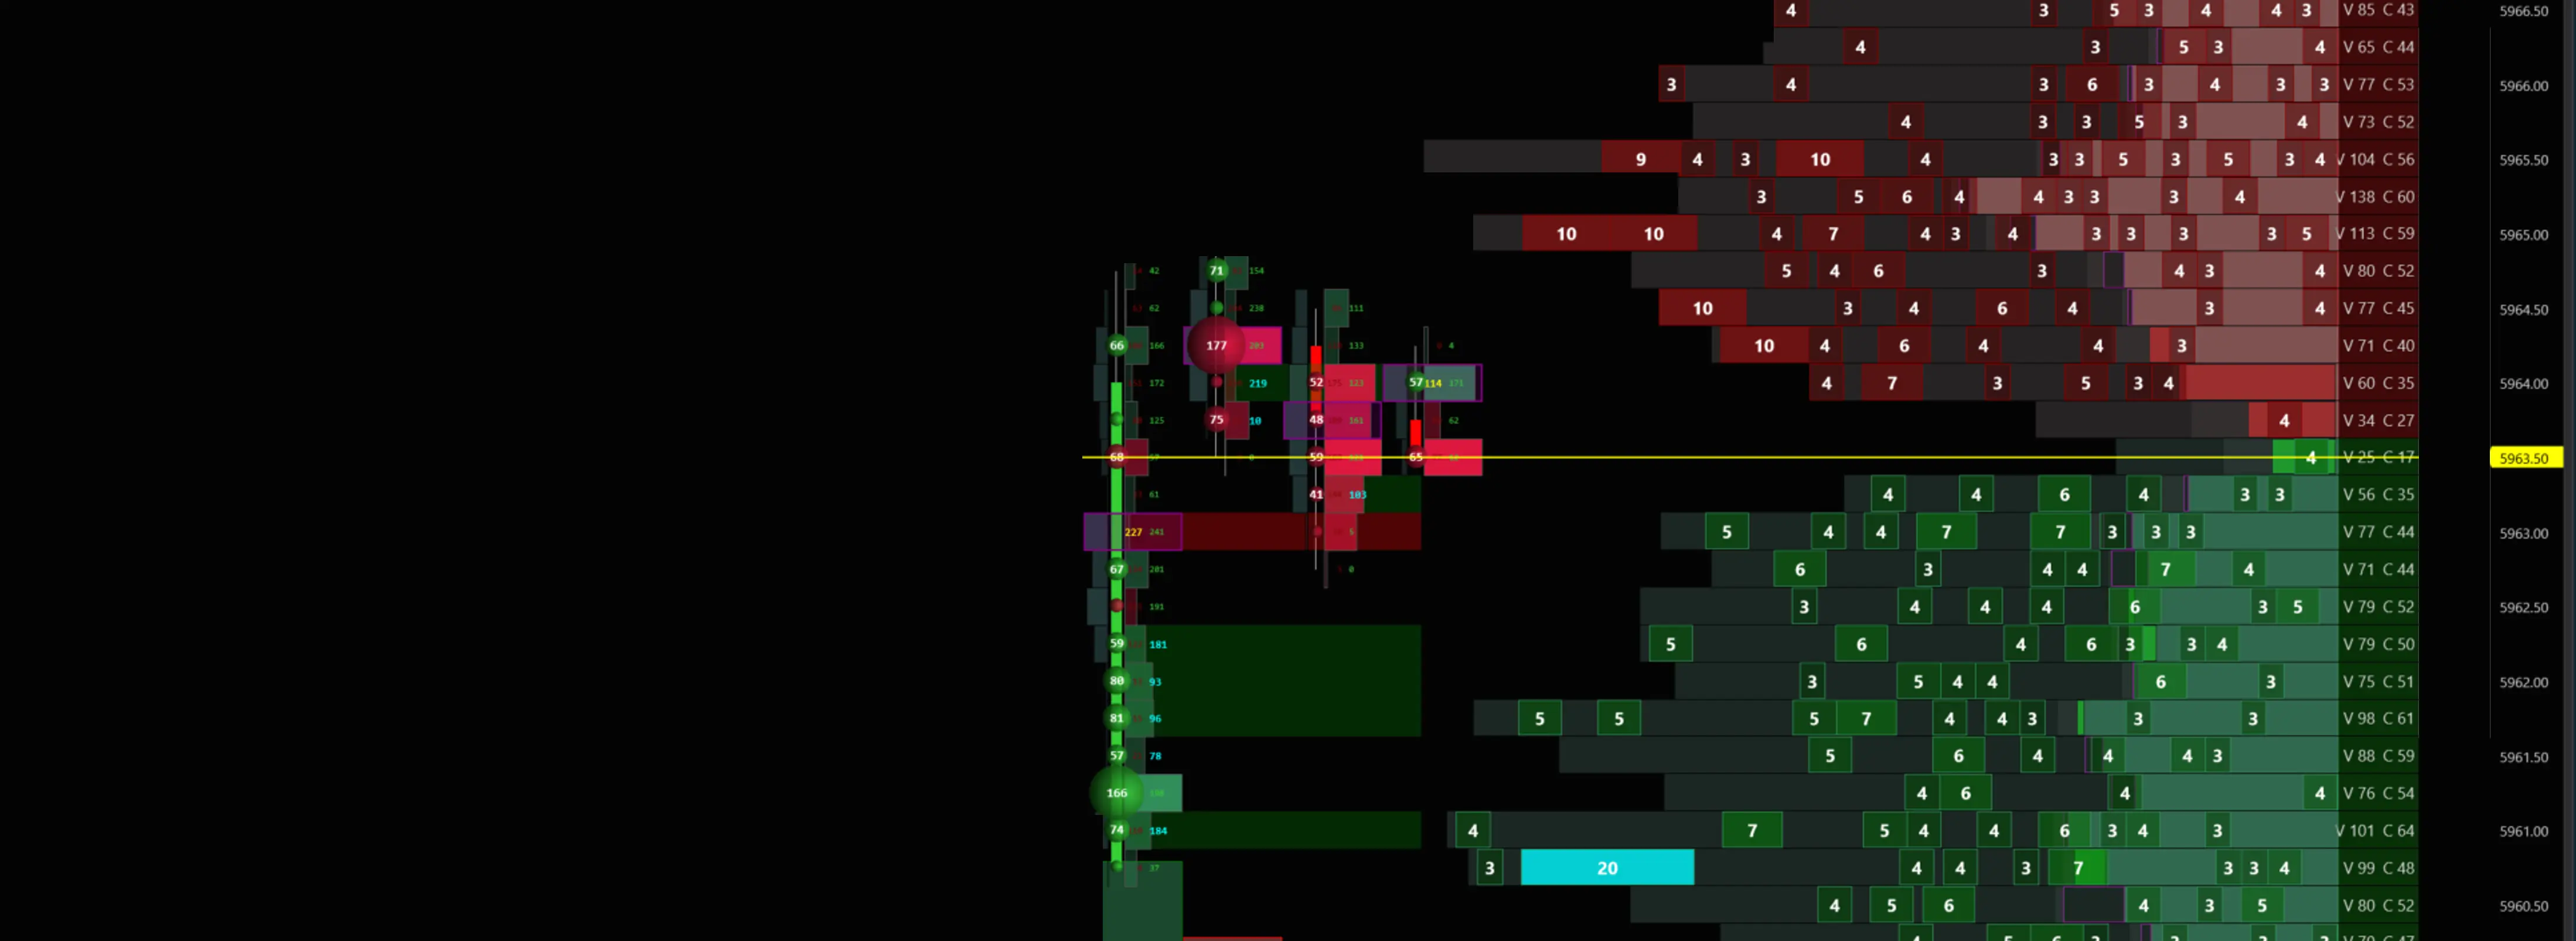
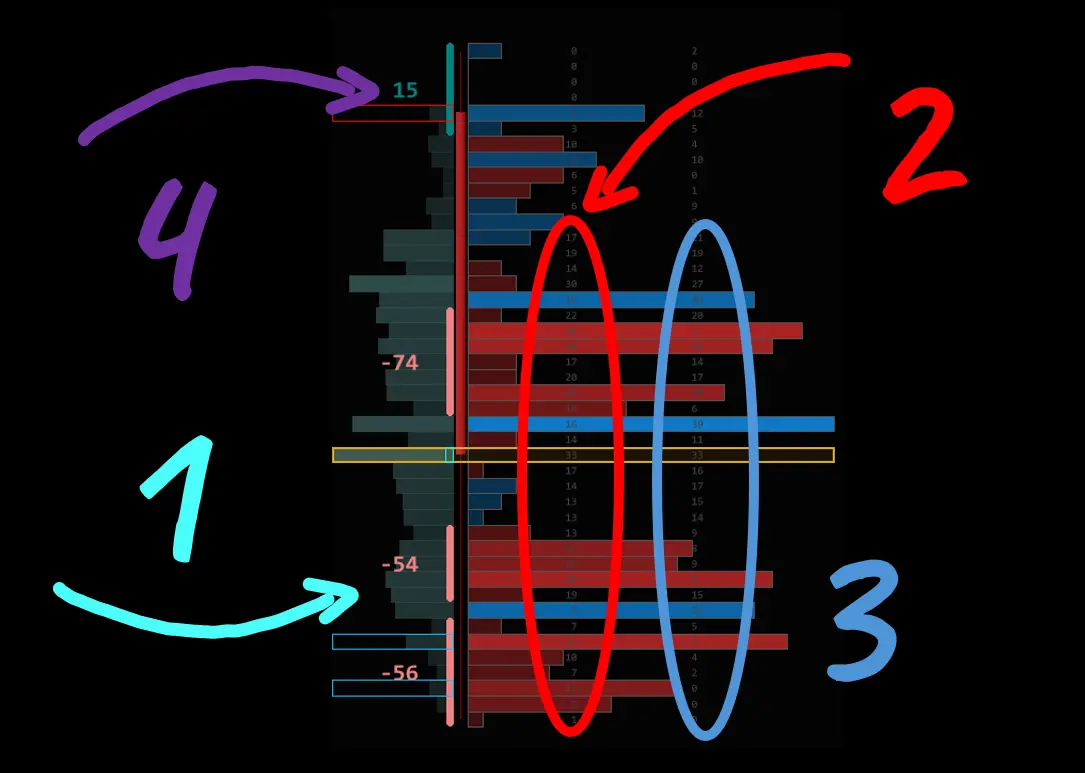
Detailed Market By Orders :
Indicators Level 3: - detailed orderbook
Trade Market By Order with level 3 data
- Distinguishing Market Maker from traders
- Predict strong and weak support and resistance
- Watch large participants' intentions in real time
- Assess liquidity void for trades during news and events
- Predict the price levels for a strong reaction in advance
- Trade Native Icebergs
Pack 2 - Passive Volume Indicators


Pack 3 - New Heatmap Indicators


MARKET BY ORDER INDICATORS
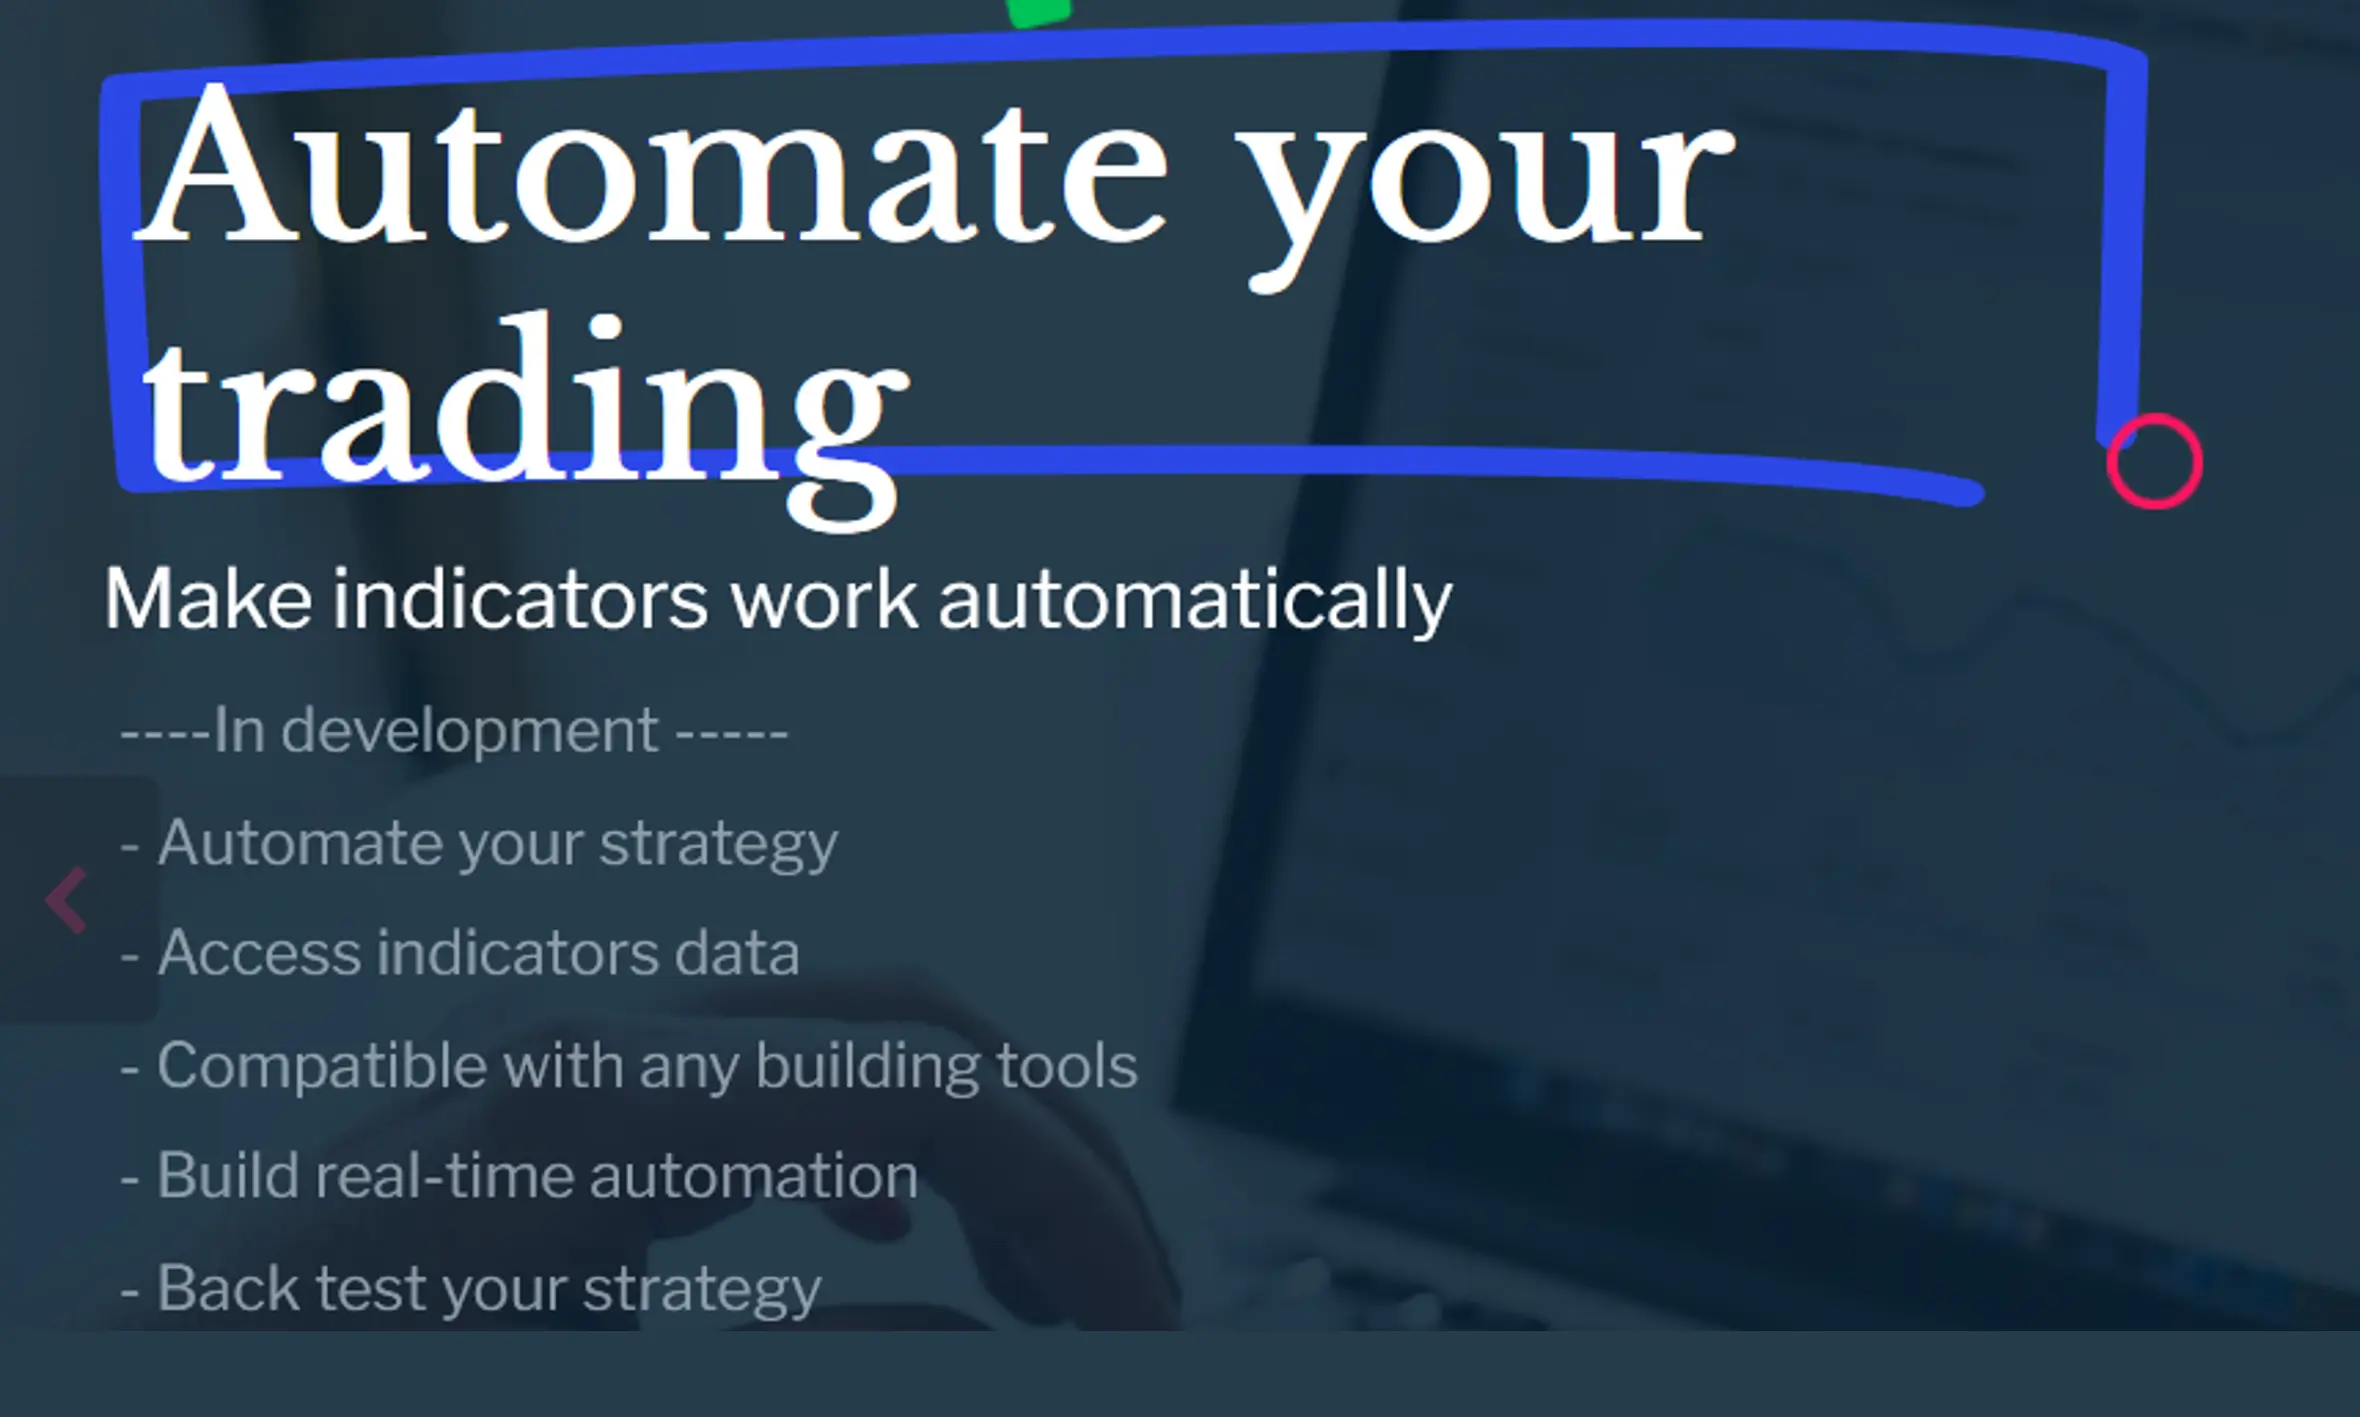
Smart Money 2.0: Price Action + Volume Action
WARNING ALL "SMART MONEY" TRADERS:
- Stop trading by guessing what order block or FVG Fare Value Gap to trade!
- Stop trading Stupid Money!
- Do not rely only on a Footprint!
- Do not rely only on Price Action alone!
Here is a compelling reason to read every word below to the end:
Warning - if you are trading ICT or Smart Money and use only Footprint, you are trading Aggressive (stupid and potentially foolish) money, which in no way represents real smart money.
Real Smart Money is sitting as limit orders on price positions that are beneficial and profitable at the moment of execution by default. The real Smart Money quietly waits until the price comes in and triggers their orders to instant profit.
Most traders have never seen passive level 2 and level 3 orders. They have no idea where the real smart money is on the real-time smart price line, as they rest their positions until aggressive ( stupid) orders come to trigger them.
DO YOU KNOW THAT
Price Action traders operate charts with stupidly aggressive entries, chasing the price.
Traders who rely solely on a Footprint are seeing only aggressive orders placed by a small, desperate part of the market.
The Footprint shows only ONE SIDE of the orders - it is Level 1 data.
The other side of the market, including Market Makers and institutional big players, sits on the passive side of the market, at Levels 2 and 3.
The only way to see a passive side of the market is on a Heatmap, and MBO
LEVEL 3 and Level 2 Indicators
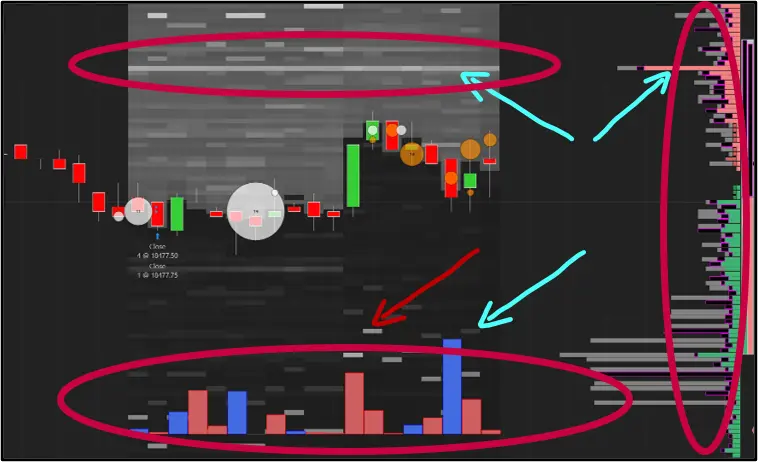
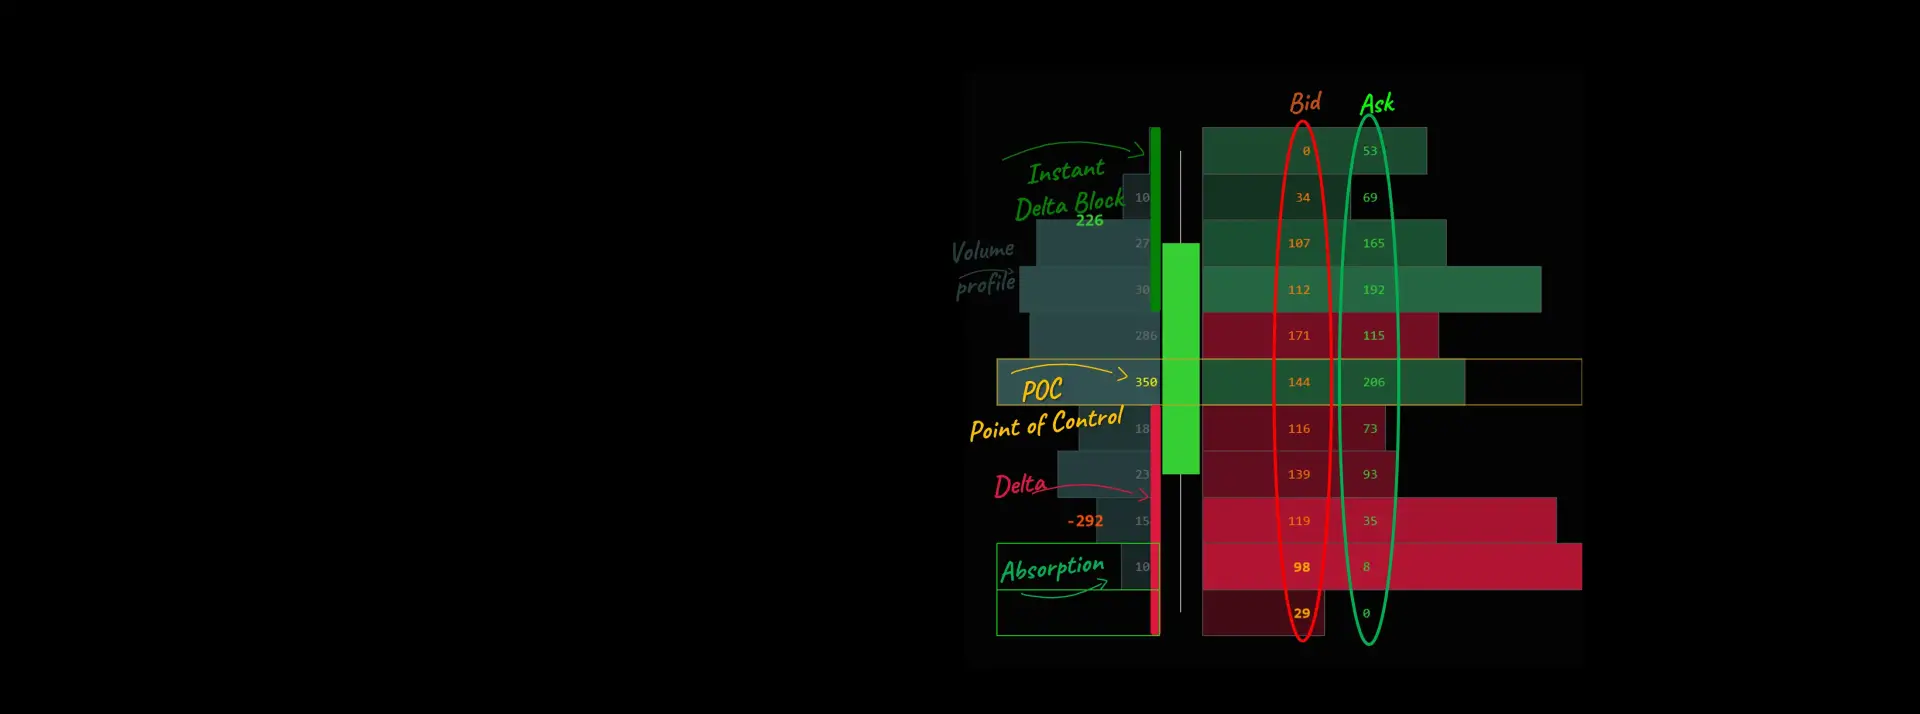
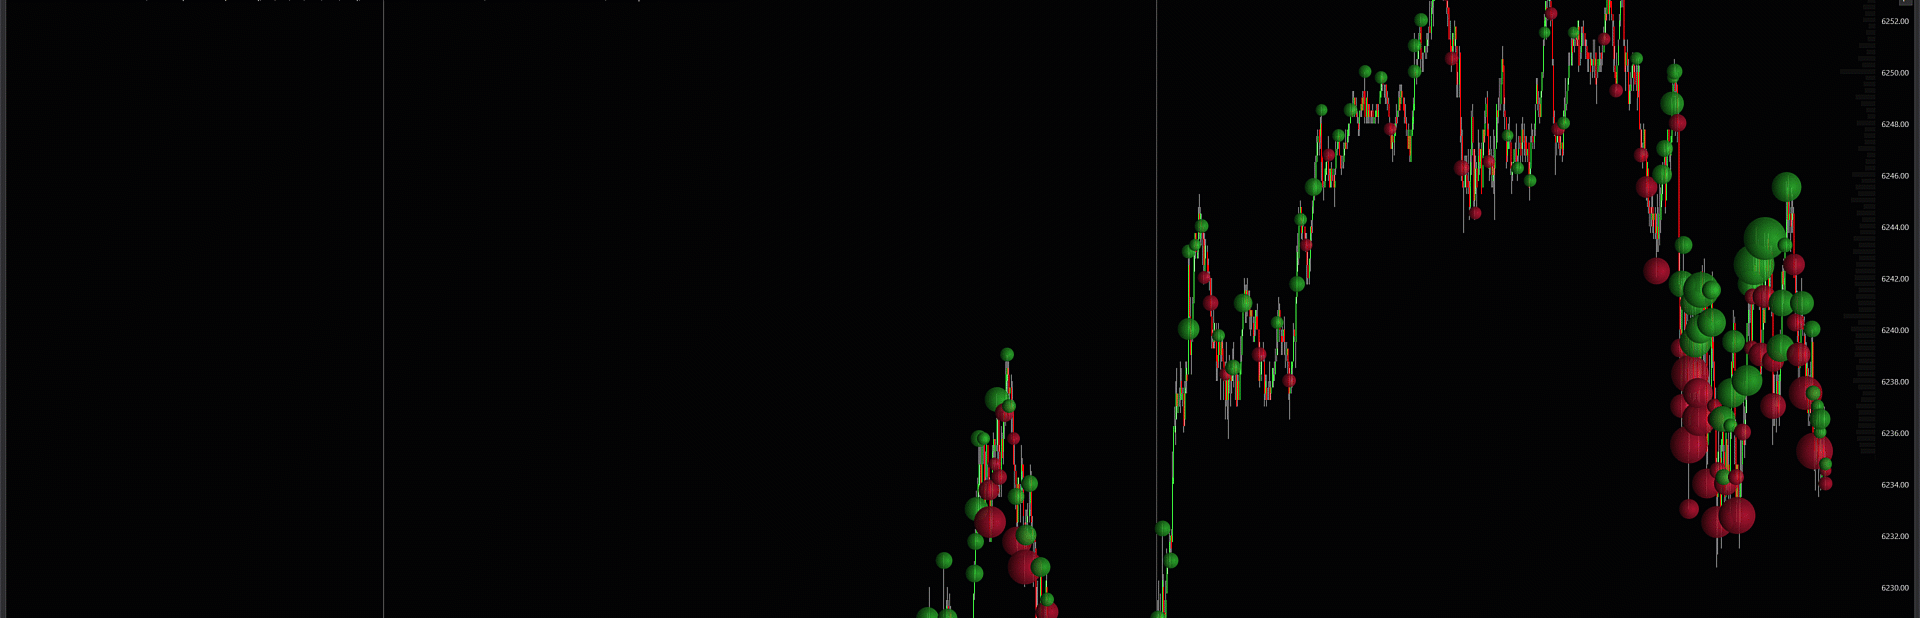
HEATMAP: The Heatmap NT indicator displays the time spent and the size of orders on a particular price level.
MBO - Market By Order indicators display Level 3 data, which shows real-time intentions for passive orders. MBO displays the volume of each order size, the number of lots, and the sequence for fulfillment (distance to the queue). We can track their intentions and real-time execution with absolute precision. We now know what a price level is strong or weak in real-time.
Want to detect absorption and real icebergs? This is only possible with the Level 3 MBO indicator. If you see any icebergs without MBO, they are not genuine Native icebergs, so you should exercise caution when trading. It is a joke.
ONE QUESTION:
My question- are you trading only 1/2 of the ORDER FLOW with Footprint or Price Action - or are you trading a COMPLETE ORDER FLOW with Footprint + Heatmap + MBO?
WHY DEPOSIT KILLER?
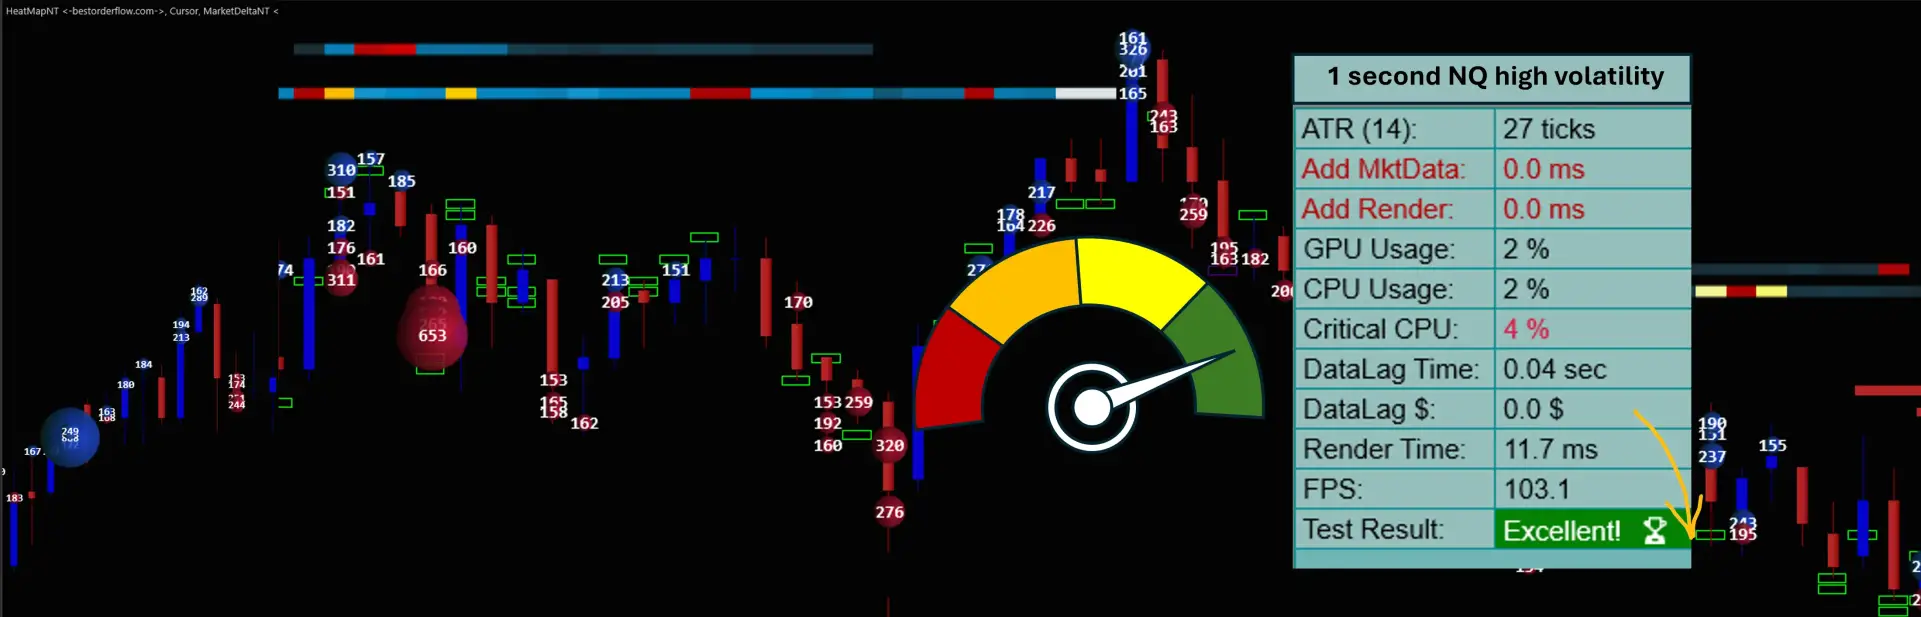
If you have never tested your trading chart speed, you are setting yourself up for failure:
You can conduct a simple speed test yourself using the Deposit Killer indicator to see the real outcome and measure the performance of any indicator, coupled with a Heatmap or any level 2 indicators.
The Deposit Killer detects data lag time, rendering speed, and CPU performance in real-time, even under high market volatility conditions or when artificially overloading your system.
NOW YOU CAN:
Now you can trade complete order flow because you can use the Detailed by Market Orders integrated with Heatmap and natively integrated with Footprint. And trade on the same chart on the same broker you already have on NinjaTrader!
No need to use any other analytical platform(s) for analysis and then place your orders on NinjaTrader.
You should and must trade only natively compatible and fastest-performing indicators, especially if you use any automation, High Frequency Trading ( HFT), algorithms, bots, or AI systems.
Why are these three indicators —Advanced Footprint, HeatmapNT, and MBO —natively compatible? They are compatible in terms of speed and performance and can run on the same chart without interference or hiccups.
MBO, HeatmapNT, and Advanced Footprint released by BestOrderFlow.com work smoothly and FAST for High-Frequency, manual, and automated orders execution like no other indicators from any other source(s).
If you have ever used Heatmap from any other developers, you most likely experienced freezing on a New York Open during High volatility.
And no one before was able to solve that problem. (See our test results with other heatmaps, which all froze after 5-8 minutes.)
How can you trade with a chart lagging one to 10 minutes behind the real price? Until now....
THE ULTIMATE SOLUTION:
Until now, you can use high-speed HeatmapNT with Footprint and MBO - all levels of Data - level 1, level 2, and level 3 - all on the same chart.
Now you can trust indicators to trade real money in real-time with the fastest-ever speed of execution.
Now you can trade a complete order flow: all levels, 1-2-3 data, and both sides of the market on a single chart!
- Want to trade Price auction Smart Money more confidently than ICT? Now you can!
- Want to see hidden liquidity from big players and Market Makers? Now you can!
- Want to trade hidden Real Support and Resistance? Now you can!
- Want to change your side from Stupid Money to Real Smart Money? Now you can!
- Want to trade a COMPLETE Order Flow? Now you can!
SORRY, IT IS NOT FOR EVERYONE:
...If you are a trader, day trader, swing trader, and scalper, how can you trade without MBO, Heatmap, and MBO?
Trading without MBO, HeatmapNT, and Advanced Footprint is like being intentionally blind.
- Why not start trading a complete order flow with both sides of the market?
- What stops you from trading with precision and accuracy as never before?
- Why not?
Here's what has now become possible:
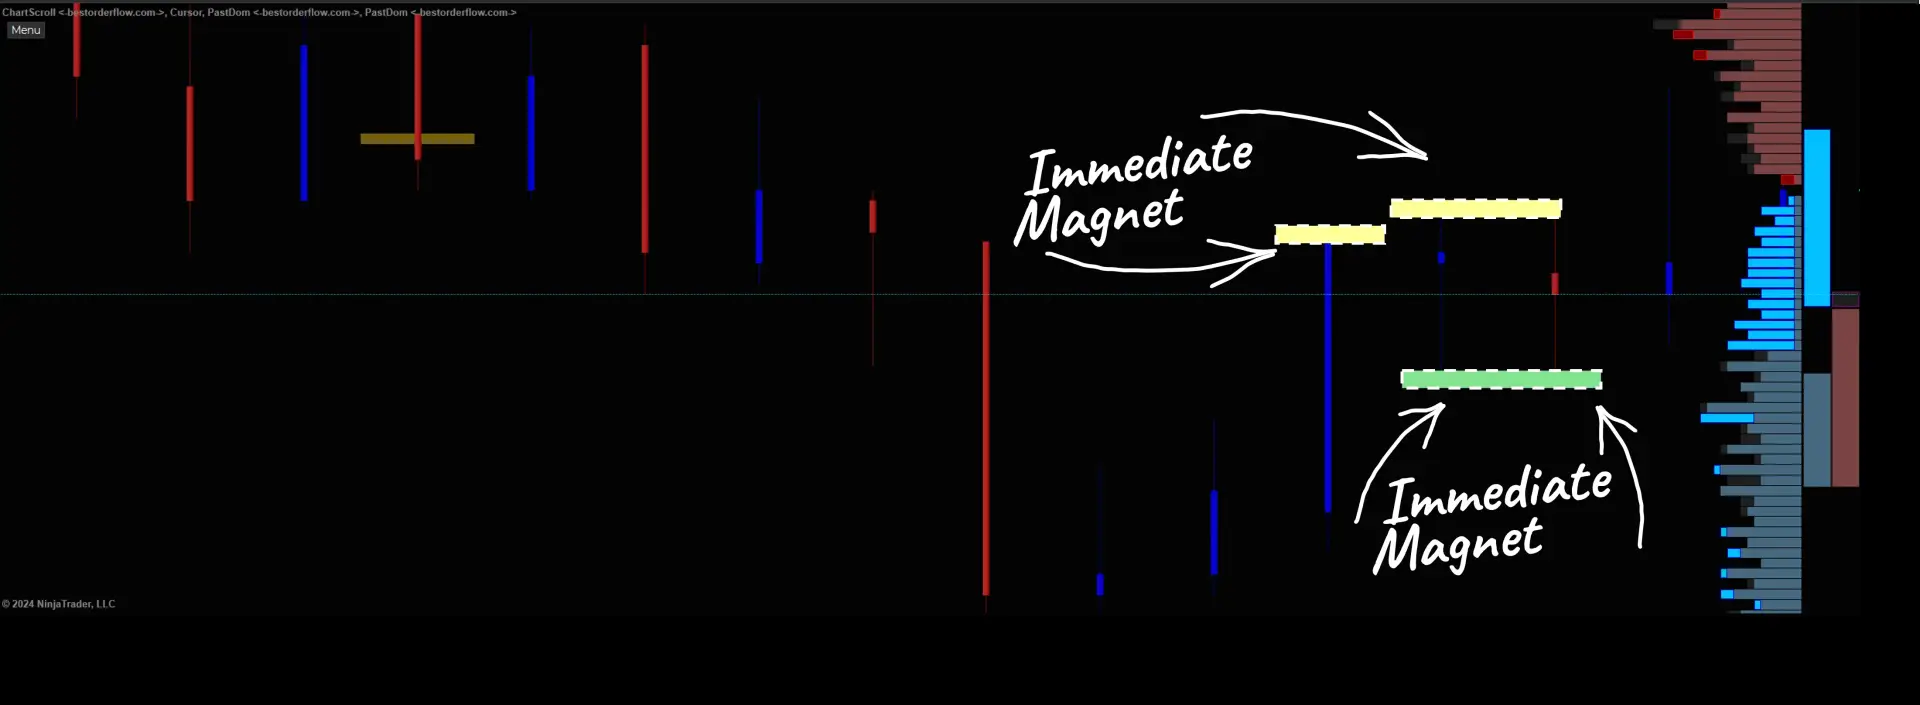
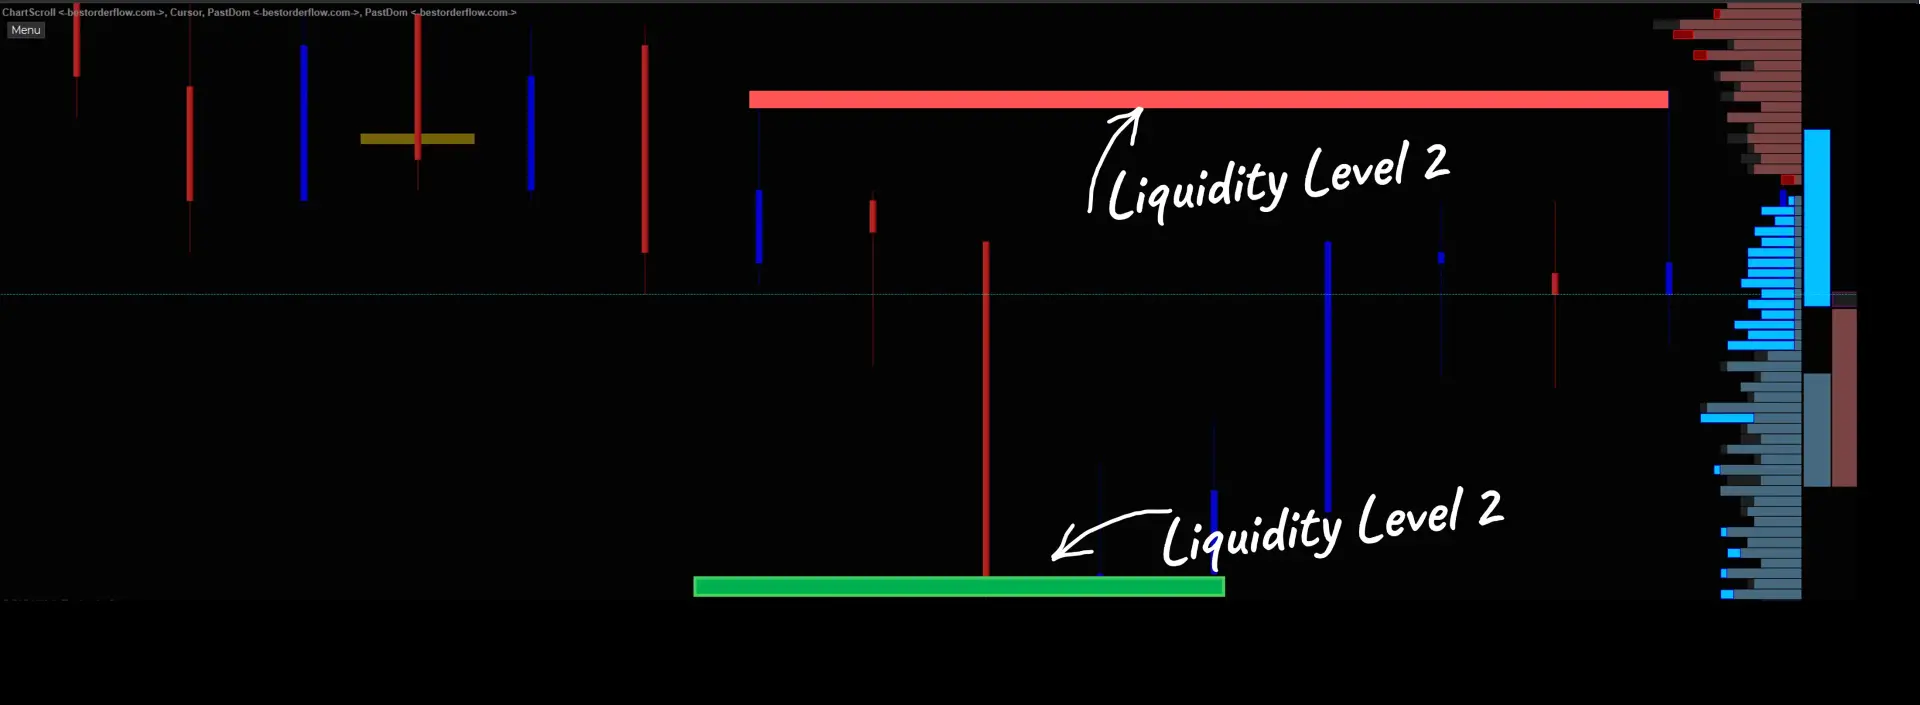
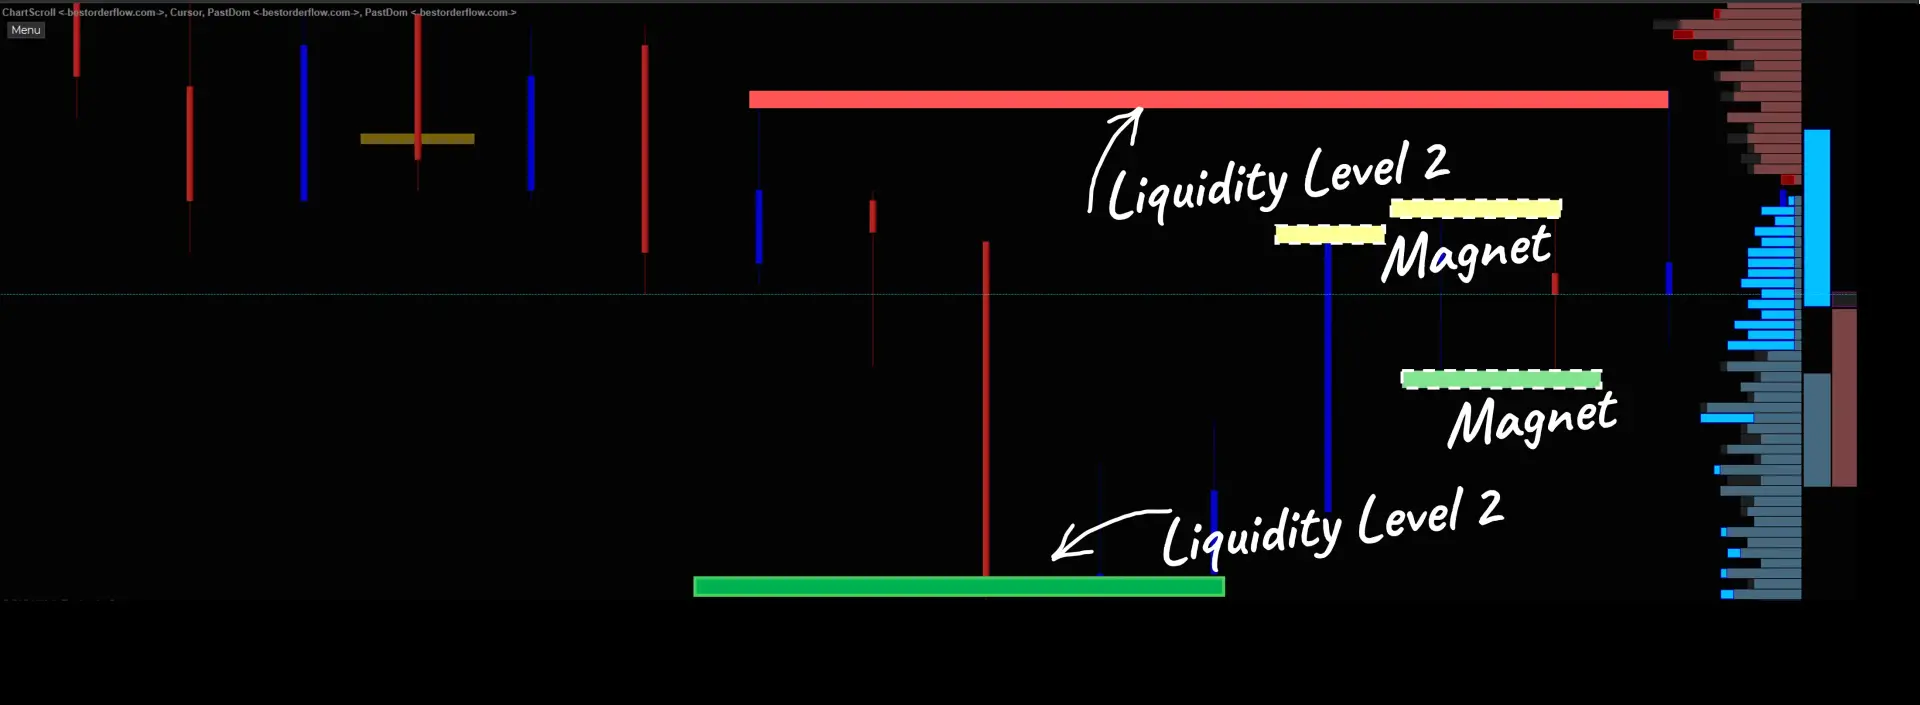
- Trade interactions between Level 1 and Level 2 data
- Develop completely new, innovative strategies that no one has used before
- Create super-fast automation systems, bots, and algorithms
- Analyze price manipulation and hidden orders
- Trade Level 2 support and resistance zones
- Trade hidden liquidity levels
- Trade liquidity flipping
- Trade real icebergs and absorption
New strategies are emerging based on understanding interactions between aggressive and passive volumes.
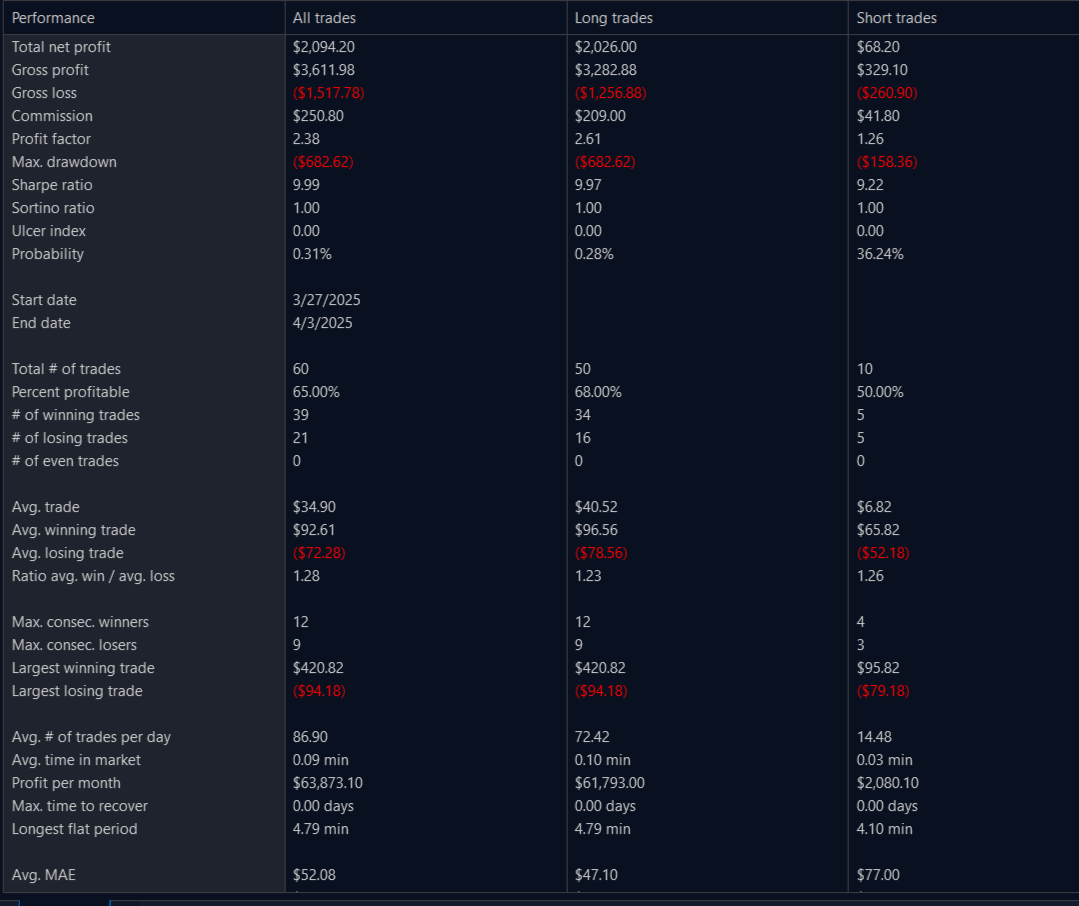
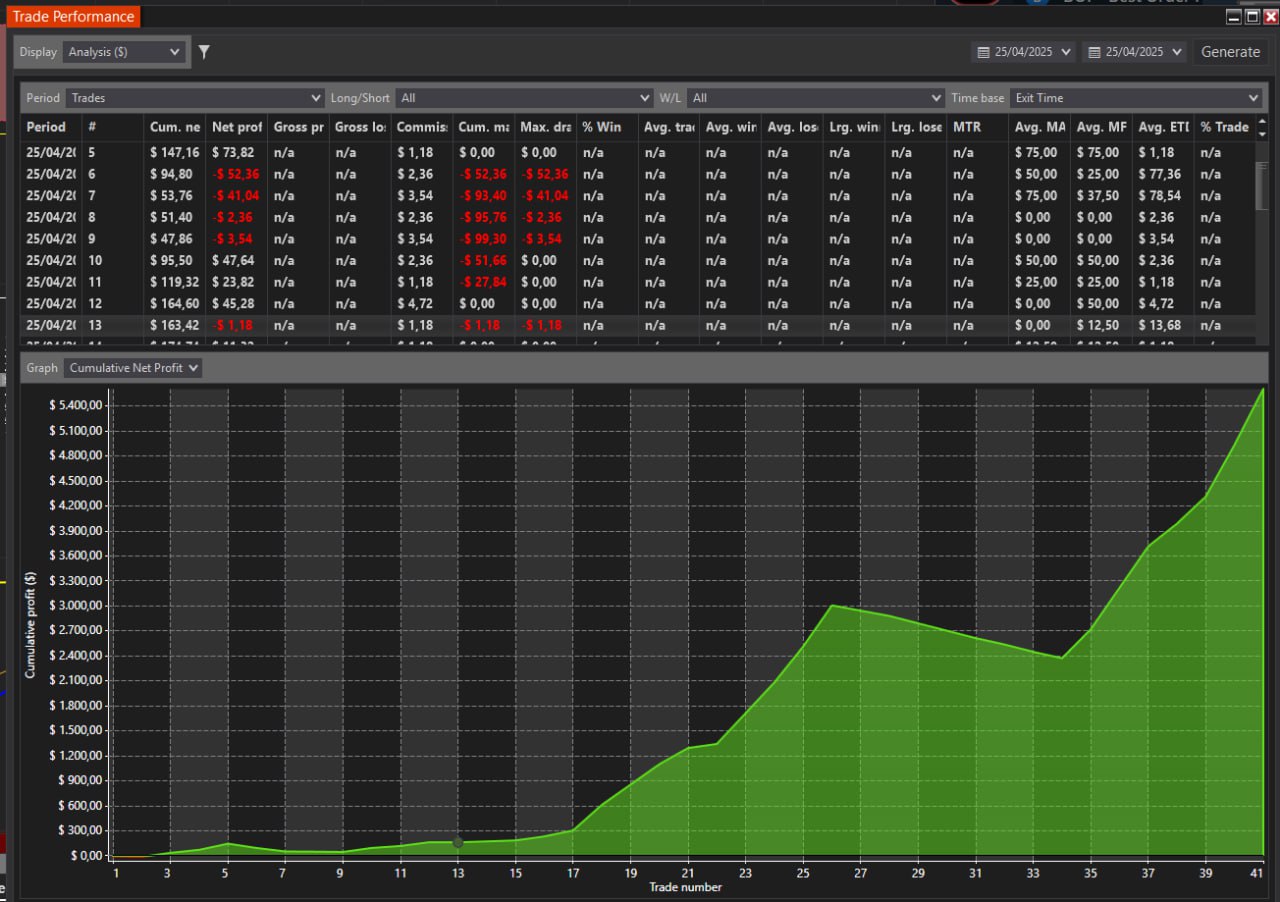
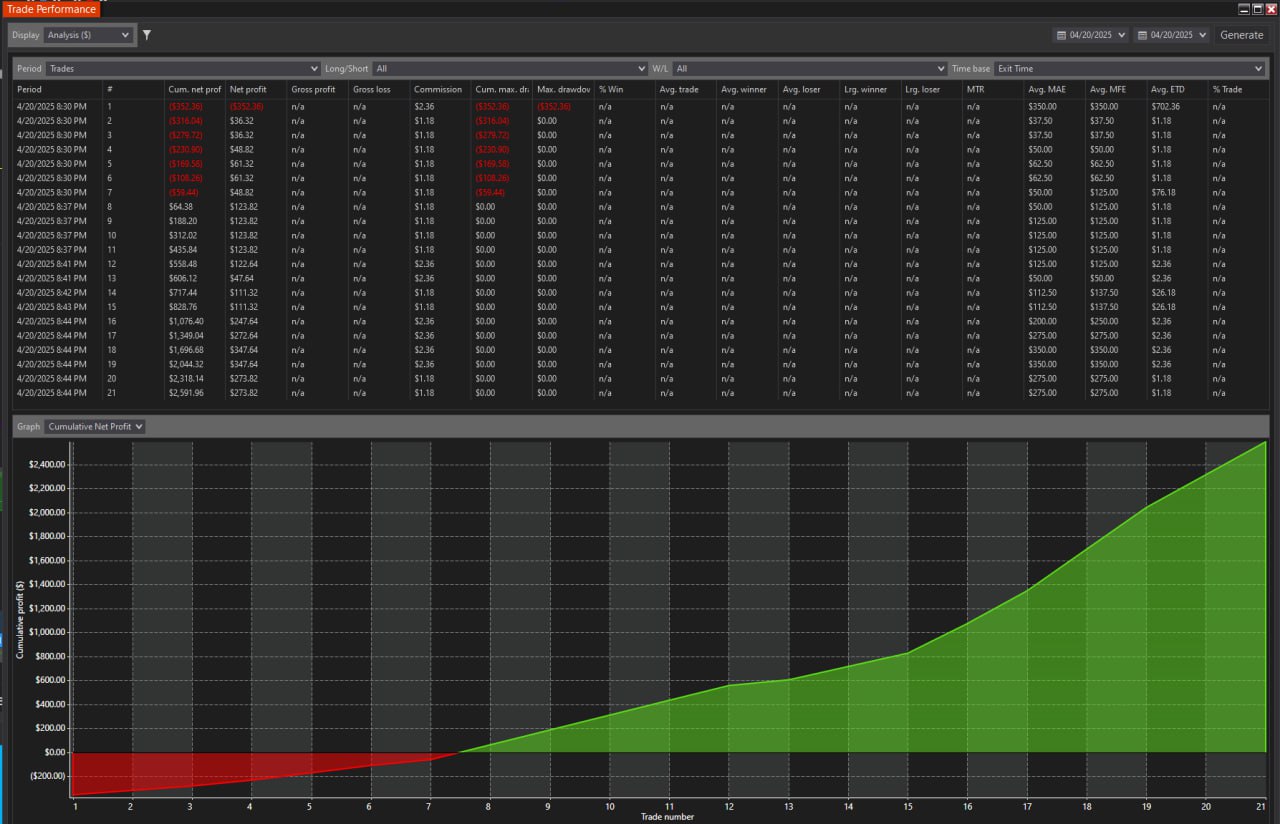
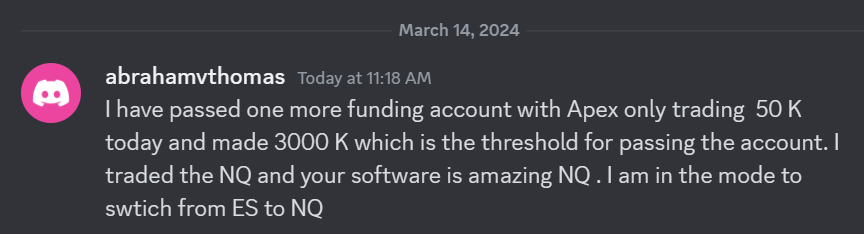 I have passed one more funding account with Apex Trading today and made $3,000, which is the threshold for passing the account. I traded NQ, and the Bestorderflow indicators are excellent for passing props.