SPEED UP NINJA TRADER CHARS
LAG AND PERFORMANCE FOR NINJATRADER CHARTS:
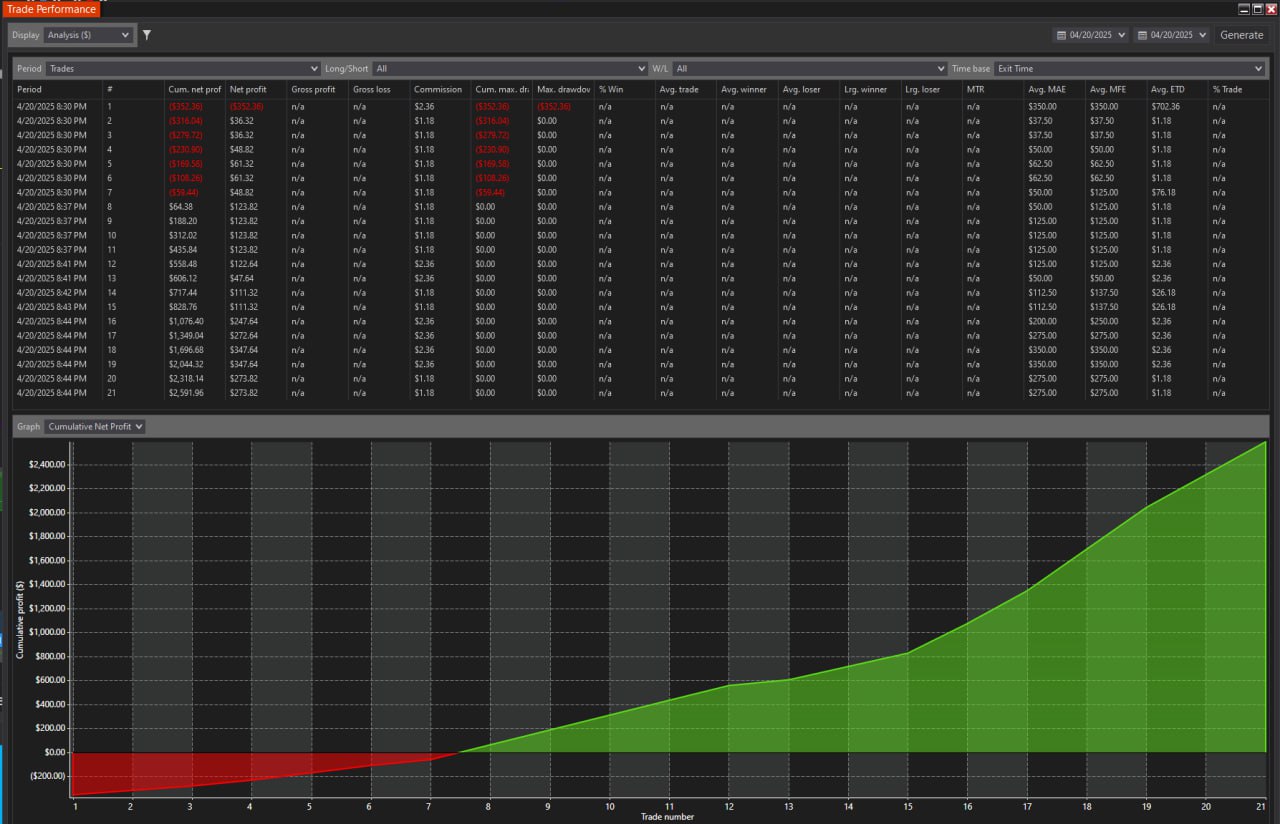
Would you want to know what indicator (s) slowing your charts?
Do you have a silent account killer on your chart?
The Heatmap NT from BestOrderFlow is the champion in speed and performance:
Heatmap NT from Bestorderflow.com is the only heatmap that remains operational in high-volatility tests.
In contrast, all other heatmaps freeze after 8 minutes on the NY market open.
- With every second chart delay, you lose at least $50 on 1 contract. Why should you
- Compare the performance of indicators on your charts
- Ditch out indicators that are not performing as champions.
- Download free Deposit Killer indicator to measure your charts and individual indicators performance that slowd your trading.
Publicly Open Multi-Parameter Formula for Testing:
Data Lag Time - CPU waiting time
0 to 1 sec = Good
1 to 5 sec = Bad
5 + and more = Danger
Render Time
50 ms or less = Excellent
50 - 100 ms = Good
100 - 200 ms = Bad
200 and more = Danger
FPS - Frames per second
Excellent = 20 and more
Good = 10-20
Bad = 5-10
Danger = 0- 5
Overal Results:
Excellent = plenty of resources
Good = be careful with ATR volatility
Bad = stop immediately
Danger = big losses
Can your Indicators survive a high volatility test?
Here is what they never want you to know:
- Run the free Deposit Killer Indicator to find out objective data results.
- Evaluate each indicator on your chart to assess its actual performance.
- Trust only the data revealed in the comparison test during periods of high volatility.
- With Deposit Killer, you can test any indicator and chart.
- Use our step-by-step guide to test indicators correctly, ensuring the most accurate and reliable results.
- Download and follow the step-by-step PDF manual and video explainer to test any indicators and charts.
Download DepositKiller Indicator file
Download Manual English version:
The Heatmap NT from BestOrderFlow is the champion in speed and performance:
Heatmap NT from Bestorderflow.com is the only heatmap that remains operational in high-volatility tests.
In contrast, all other heatmaps freeze after 8 minutes on the NY market open.
Three other Heatmaps ( not from bestorderflow.com)
froze at 5 minutes, 7 minutes, and 8 minutes of operation.
Watch this video and download NT Optimiser and Deposit Killer below the video:


LINKS FOR PACK 1 INDICATORS
(links open in a new window) :
- Footprint indicator for NinjaTrader : Bid/ Ask, Stack imbalances, Filtered imbalances, Clusters, Absorption, Diversions, Delta blocks, Delta visualization,
- Volume and Delta profile indicator for NinjaTrader is a horizontal histogram that displays the volume spread across vertical price levels. It shows traders where the most activity occurs at specific price points. The volume profile provides insights into market liquidity and potential support and resistance levels.
- Delta Footprint Style for NinjaTrader
- Footer indicators for NinjaTrader: Volume indicator, indicator for Delta bid, and Ask,
- Market Speed indicator (speed of tape) for NinjaTrader for NinjaTrader,
- Absorption indicator on the Footprint indicator for NinjaTrader.
- Utilities for NinjaTrader (click to learn more): Trade visualization indicator, Chart Scroll advanced
- Templates for Pack 1 Indicators - Chart Templates and Indicator templates for the NinjaTrader platform included
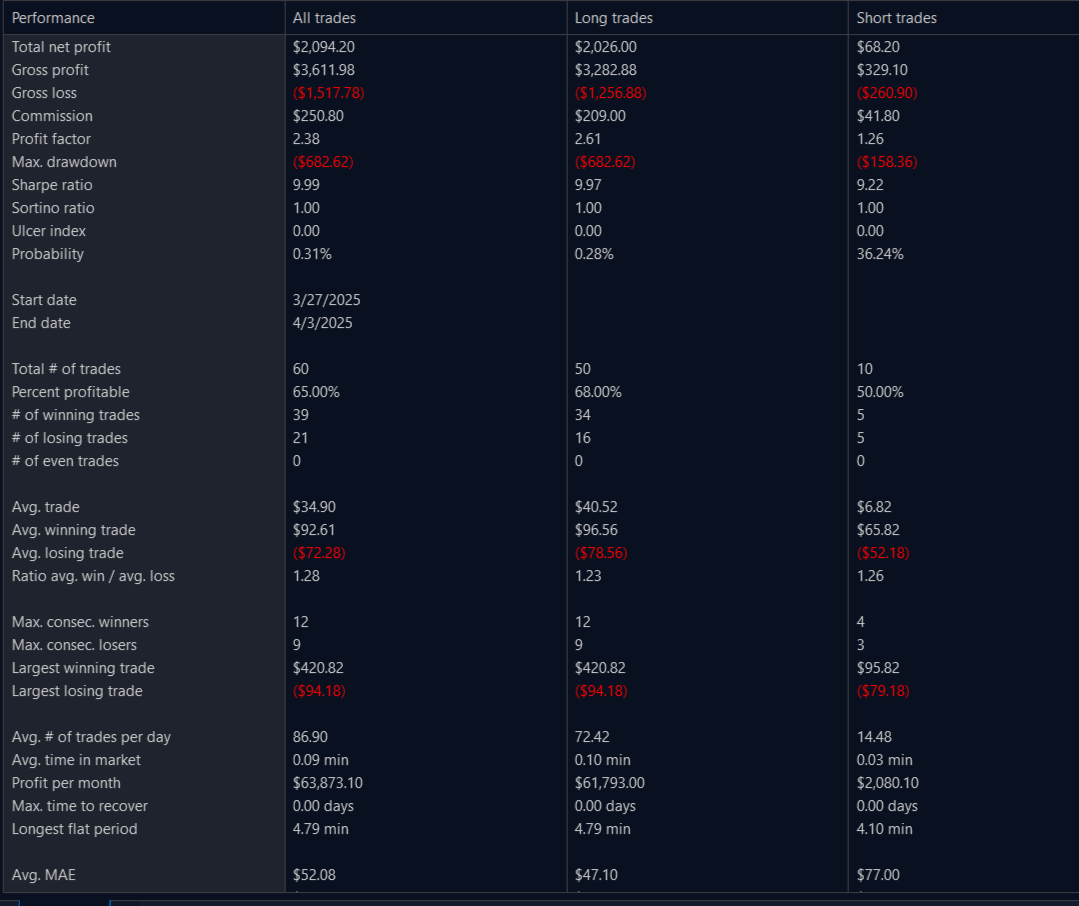
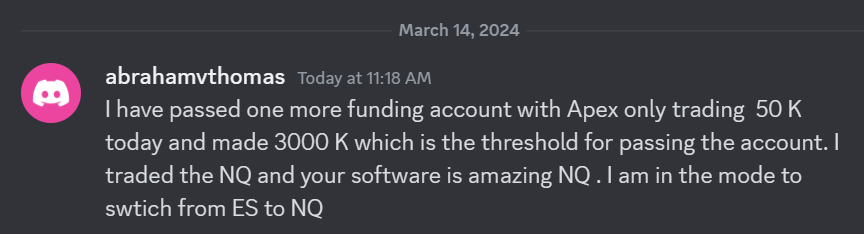 I have passed one more funding account with Apex Trading today and made $3,000, which is the threshold for passing the account. I traded NQ, and the Bestorderflow indicators are excellent for passing props.