PASSIVE VOLUME INDICATORS- PACK 2:
Quick Summary: Passive volume indicators display resting, waiting, and passive limit orders of passive participants.
The data used by passive participants is level 2 data. Rhythmic level 2 data is the recommended data provider.
Level 2 data displays a list of passively waiting resting limit orders on the Live DOM, along with the historical time spent on the Heatmap, including the size and time spent at the price at which it's placed. Level 2 data is less detailed than Level 3 MBO data.
Passive orders generate real liquidity that is distinct from liquidity triggered by stop-loss orders. Traders who rely solely on price action often use stop-loss-triggered liquidity. Accurate and reliable support and resistance zones, as well as levels, are based on passive liquidity from Level 2 limit orders.
DEFINITION LEVEL 2 DATA:
In Level 2 data, "passive indicators" generally refer to indicators that reflect the presence of limit orders, which are orders placed with a specific price that are not immediately filled. These orders, which represent market participants' willingness to buy or sell at a particular price, are displayed at different price levels in the order book beyond the best bid and ask prices.
- Level 2 Data: This type of market data offers a more comprehensive view of the order book than Level 1 data, which only displays the best bid and ask prices. Level 2 data displays the depth of the market, showing the number of buy and sell orders at various price levels.
- Passive Indicators: These indicators, often referred to as "limit orders," represent the interest of market participants in buying or selling at specific prices, rather than immediate execution at the market price.
- How they Work: When a trader places a limit order, it is added to the order book at the specified price, either on the bid (buy) side or the ask (sell) side. These orders remain in the order book until they are either filled (matched with another order) or canceled by the trader.
- Real-Time Display: Level 2 data displays these limit orders on the Live DOM in real-time, showing the market depth and the accumulation of orders at different price levels. This information helps traders understand the potential support and resistance zones and anticipate potential price movements.
- Examples: Passive indicators that can be observed in Level 2 data include large blocks of orders at specific price levels, the number of orders available at different prices, and the speed at which orders are being filled or canceled.
- Benefits: By analyzing Level 2 data and observing passive indicators, traders can gain insights into the overall market sentiment, identify potential support and resistance levels, and anticipate potential price reversals or breakouts.
PACK 2 INDICATORS LINKS
(links open in a new window) :
Links for Pack 2 indicators: Passive side of orderflow:
- Live DOM (click to learn more):
- Pulling and stacking in a Live Dom
- Total Pulling and Stacking on a live Dom,
- Past DOM (click to learn more):
- Two-color heatmap
- Delta for Pulling and Stacking (horizontal indicator above footer).
- Dom - vertical histogram for level 2 passive orders
- Big Trades (click to learn more)
Based on level 1 data, aggressive orders by market:
LIVE DOM INDICATOR
Live Dom indicator is part of Pack 2. What's the Live dom?
LiveDom indicator is a Depth of Market (DOM ) indicator that accurately displays the highest quoted bid and lowest quoted offer for a given asset at any given time (also called the best bid and ask, BBO, or simply the spread).
Live DOM refers to passive, limited orders placed ahead of time and awaiting execution at the current price.
The Last Dom histogram represents a collection of orders above the price line (sellers in red) and below the price line (buyers in blue or green).
The histogram displays the total volume of orders waiting at a particular price line. The more volume, the longer the red or blue line is. Shorter lines represent less total volume.
- Bid in red - resting sellers' orders on level 2
- Ask in blue or green - resting buyers' orders on level 2
Resting orders are placed ahead of time by "Limit Orders" and wait until the price moves toward them. Resting limited orders get activated by the market with aggressive side orders.
Orders interaction between the Aggressive and Passive sides of the market:
- An aggressive buy order is matched with the passive, resting sell order below the price line.
- An aggressive sell order is matched with the passive, resting buy order above the price line.
The LiveDom indicator helps make trading decisions easier and faster. Livedom is a better representation of SuperDom. LiveDom is quicker and consumes fewer computer resources than the SuperDom indicator.
PULLING AND STACKING ON LIVE DOM
Pulling and Stacking refers to the actions traders take to adjust their limit orders within the order book. Pulling and stacking refer  to the movement of liquidity, which involves the number of buy and sell orders in the order book at a specific price level. Pulling means removing or decreasing liquidity, while stacking means adding or increasing liquidity. These actions can signal potential price movements and trading opportunities.
PULLING liquidity is the process of removing or decreasing orders at a specific price level in the order book. It suggests a lack of interest or confidence in that price level, potentially indicating a weakening of support or resistance.
STACKING liquidity is added or increased at a specific price level in the order book. It suggests a strong interest in that price level, potentially reinforcing support or resistance.
Pulling and stacking are analyzed separately on the bid (buy) and ask (sell) sides of the order book. Pulling and stacking actions provide insights into the intentions of market participants, revealing changes in buying or selling pressure and market sentiment.
Pulling and stacking can be used to anticipate potential price reversals or continuations. It is beneficial for scalping on a short-term trend momentum.
- Pulling is the act of removing orders, and it creates a vacuum on the side from which it is removed.
- Stacking creates pressure from the side to which it adds orders.
 LIVE DOM PULLING STAKING TOTALS
Time in bars:
Totals provide a quick summary of the number of levels you want. On this diagram, totals are calculated for 14 price levels (30-second timeframe for ES and NQ example)
When you need a visual assessment, there is no time to make calculations.
Totals provide a quick snapshot of the situation and market sentiment.
Reset: Totals reset after a designated number of bars to keep the situation current.
You can configure a reset on 1 or 2 bars, depending on current volatility, for example.
Totals pulling and stacking are great tools for scalpers and momentum traders.
PAST DOM INDICATOR
Past Dom indicator part of Pack 2
What is the Past Dom? Past Dom is the historical order from the Live Dom. Live Dom is the orders in a moment, Past Dom - the same order's history in the past.
Past dom displays orders, time, and total volume.
- Time: the history of time spent waiting at the price level. Some orders devote time to the price level until they are executed. Some orders move away when the price line approaches them.
- Volume: the amount of volume in orders at any given moment at the price level.
History of the level 2 orders displayed as a Heatmap. Practically, PastDom is the Heatmap.
Heatmap
1) Heatmap colors: The heatmap visually separates bids and asks by color.
Bid - seller resting orders colored red. Ask - buyers' resting orders are colored green.
2) Heatmap heat:
In the Past Dom Heatmap, shades of colors represent the intensity and size of a value, with darker colors representing lower volumes and brighter colors representing higher volumes.
This visual representation enables the quick and efficient identification of areas with high and low liquidity concentration. Hovering over any area on a heat map displays volume in the tooltip.
PULLING AND STACKING DELTA
PULLING and STACKING DELTA refers to the difference in the pressure of liquidity.
Pulling and stacking Delta is a horizontal indicator at the bottom of the chart, displaying vertical bars that show the difference between pulling and stacking for each candle bar. Settings for Pulling and Stacking Delta are inside the Past Dom indicator.
BIG TRADES INDICATOR
The Big Trades indicator is included in Pack 2 and works with level 1 data. Why is it included in Pack 2? This indicator enables the immediate visualization of interactions between orders at level 1 and orders at level 2.
The Big Trades indicator lets you hide insignificant or small-sized orders from the chart.
The "Big Trades" indicator for NinjaTrader is a tool designed to highlight significant market transactions, often referred to as "aggressive" or "large" trades, that occur on the order book. These trades are typically executed in large volumes at once and are visible in the Big Trades indicator, which is a part of Pack 2 on Bestorderflow.com.
The indicator visually represents large orders with circles or bubbles (bubbles are part of the LEDGER package) to make them easily identifiable on the price chart.
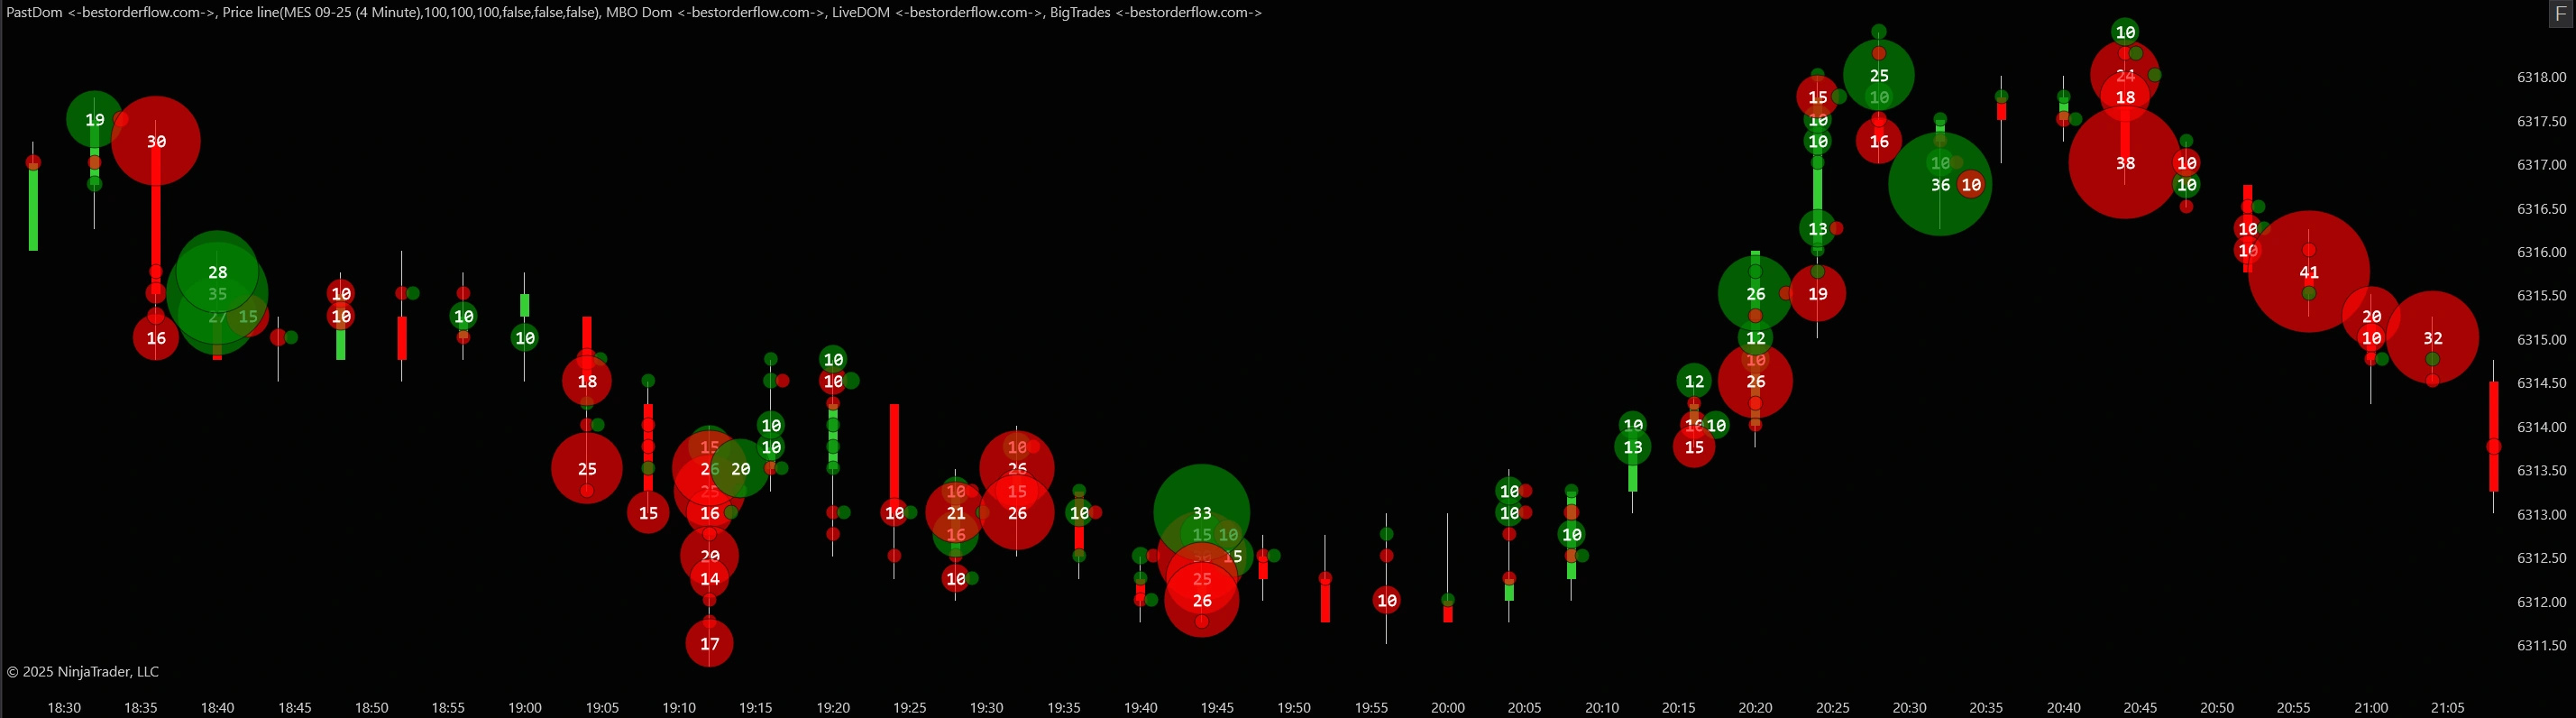
The Big Trades indicator aims to help traders quickly identify and assess the size of significant transactions in the market. The Big Trade indicator displays orders in real-time, allowing traders to stay informed about the latest significant trades as they occur.
The Big Trades indicator is often used in conjunction with other order flow analysis tools, such as the Heatmap indicator, particularly on smaller timeframes for scalping and day trading.
Big Trades is a must-have indicator and is widely used in almost any strategy, including price action, order flow, momentum scalping, pullbacks, and breakouts. The Big Trades indicator is a must-have for your trading arsenal.
VISUAL PRESENTATION LEVEL 2 INDICATORS
Watch the presentation about Indicators from Pack 2 on the main menu Level 2 https://bestorderflow.com/marketdepth
PACK 2 TRADING STRATEGIES:
Strategies based on Level 2 indicators that include Live Dom, Past Dom, delta 2, Pulling and Stacking, Big Trades
VIDEO + PDF MANUALS AND INSTRUCTIONS
Manuals / Instructions / Explainer about how to set up Footprint:
1) Download PDF Live Dom Manual ![]()
2) Download PDF Past Dom Manual ![]()
3) Download Big Trades PDF Manual ![]()
Watch video: Live Dom explainer.
Watch video: Heatmap video explainer (part of PastDom)
Big Trades - Institutional Trades Indicator Manual
Watch Big Trades explainer video:
PACK 2 INDICATORS LINKS
(links open in a new window) :
Links for Pack 2 indicators: Passive side of orderflow:
- Live DOM (click to learn more):
- Pulling and stacking in a Live Dom
- Total Pulling and Stacking on a live Dom,
- Past DOM (click to learn more):
- Two-color heatmap
- Delta for Pulling and Stacking (horizontal indicator above footer).
- Dom - vertical histogram for level 2 passive orders
- Big Trades (click to learn more)
Based on level 1 data, aggressive orders by market:
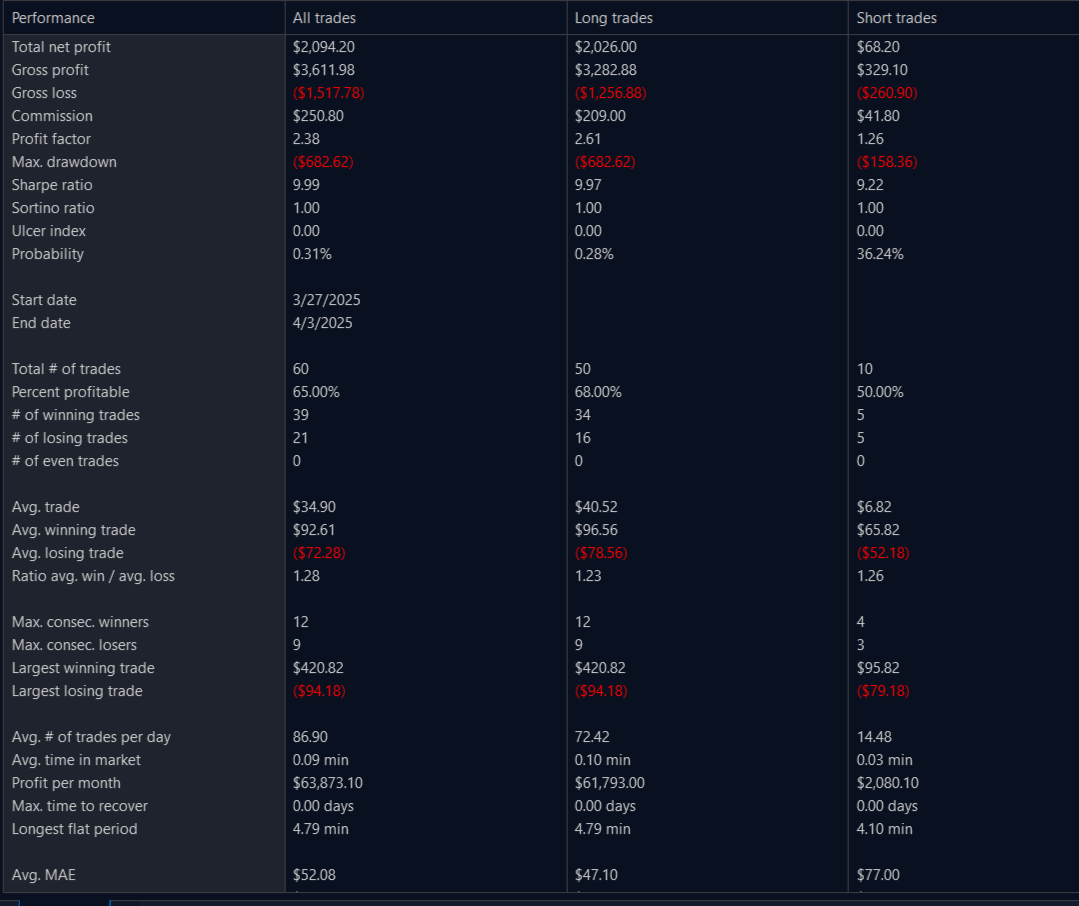
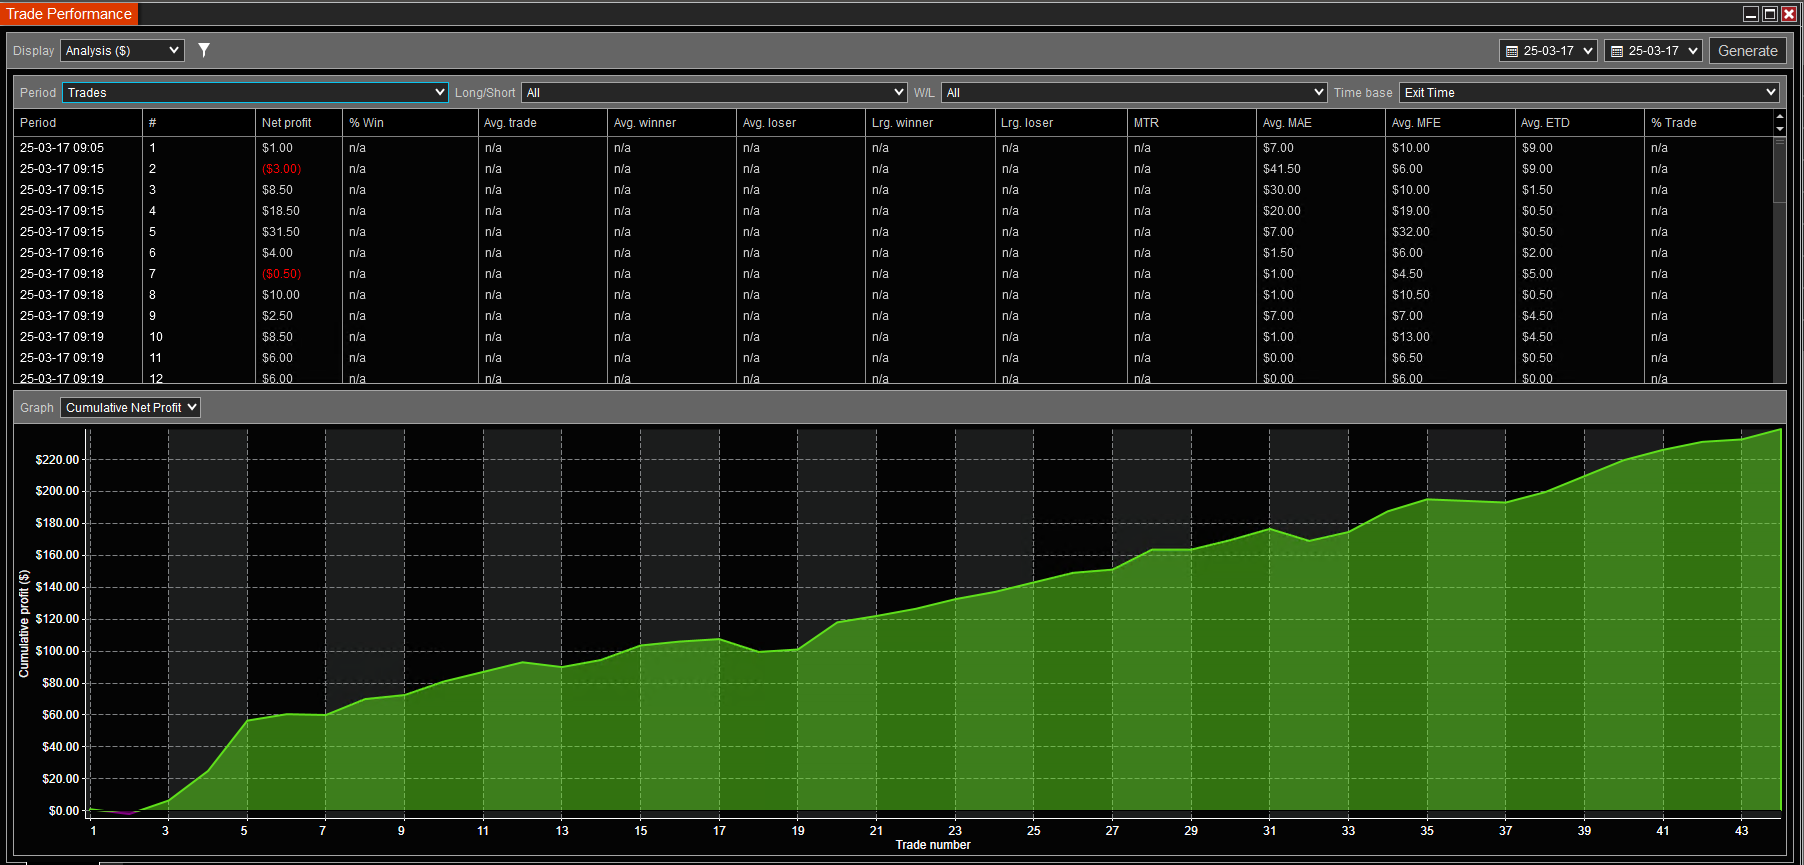
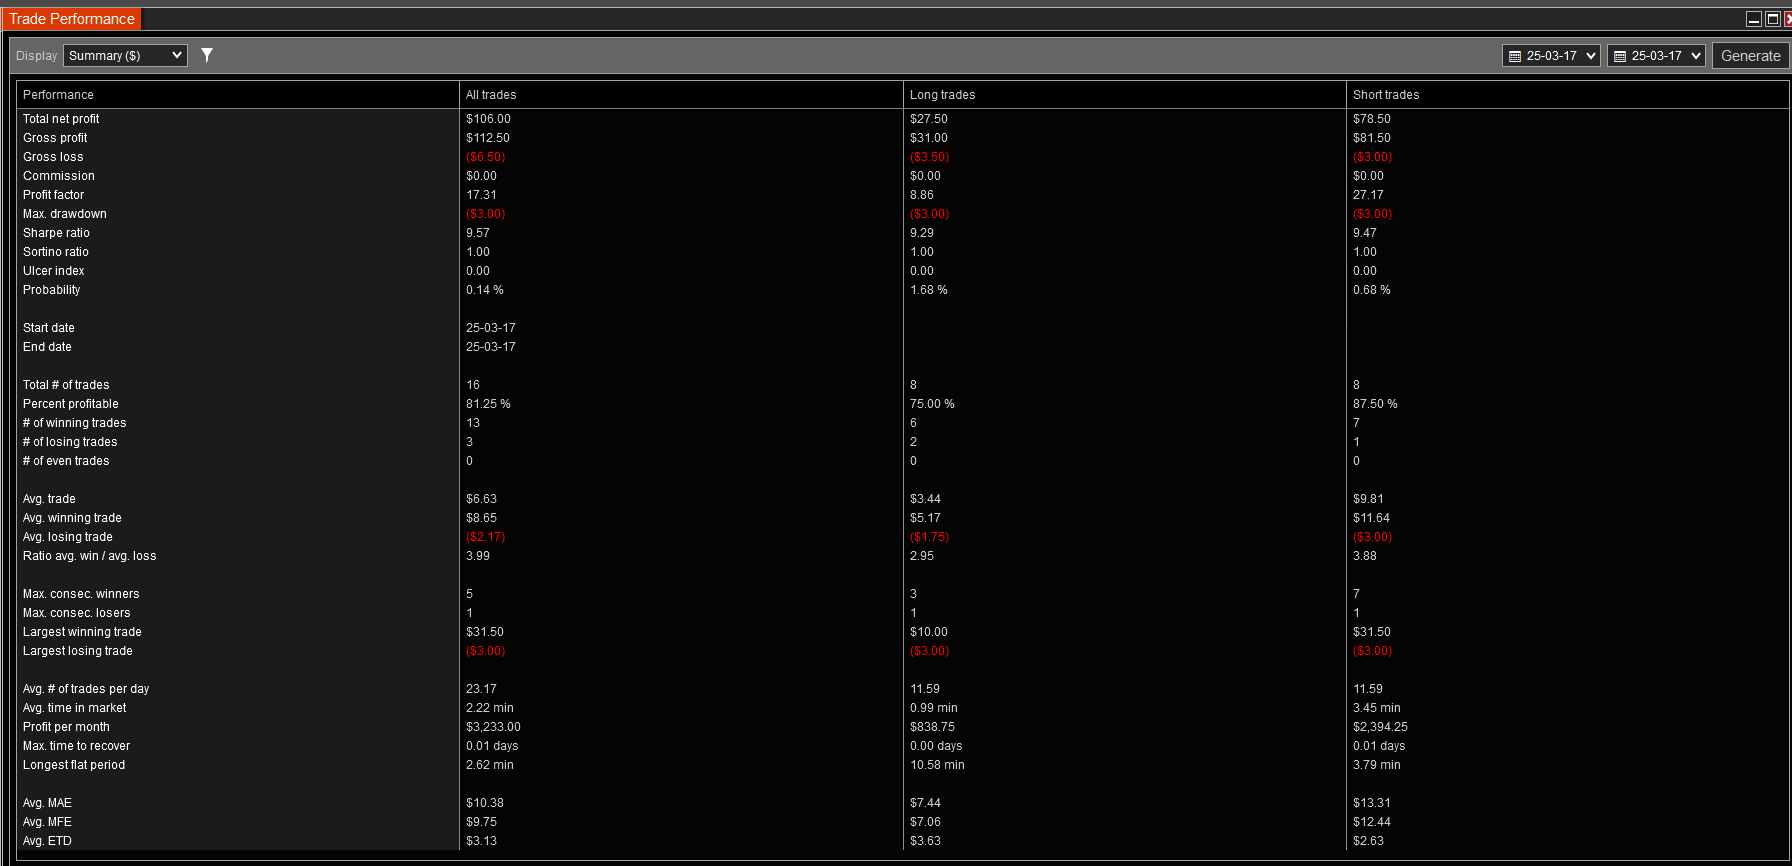
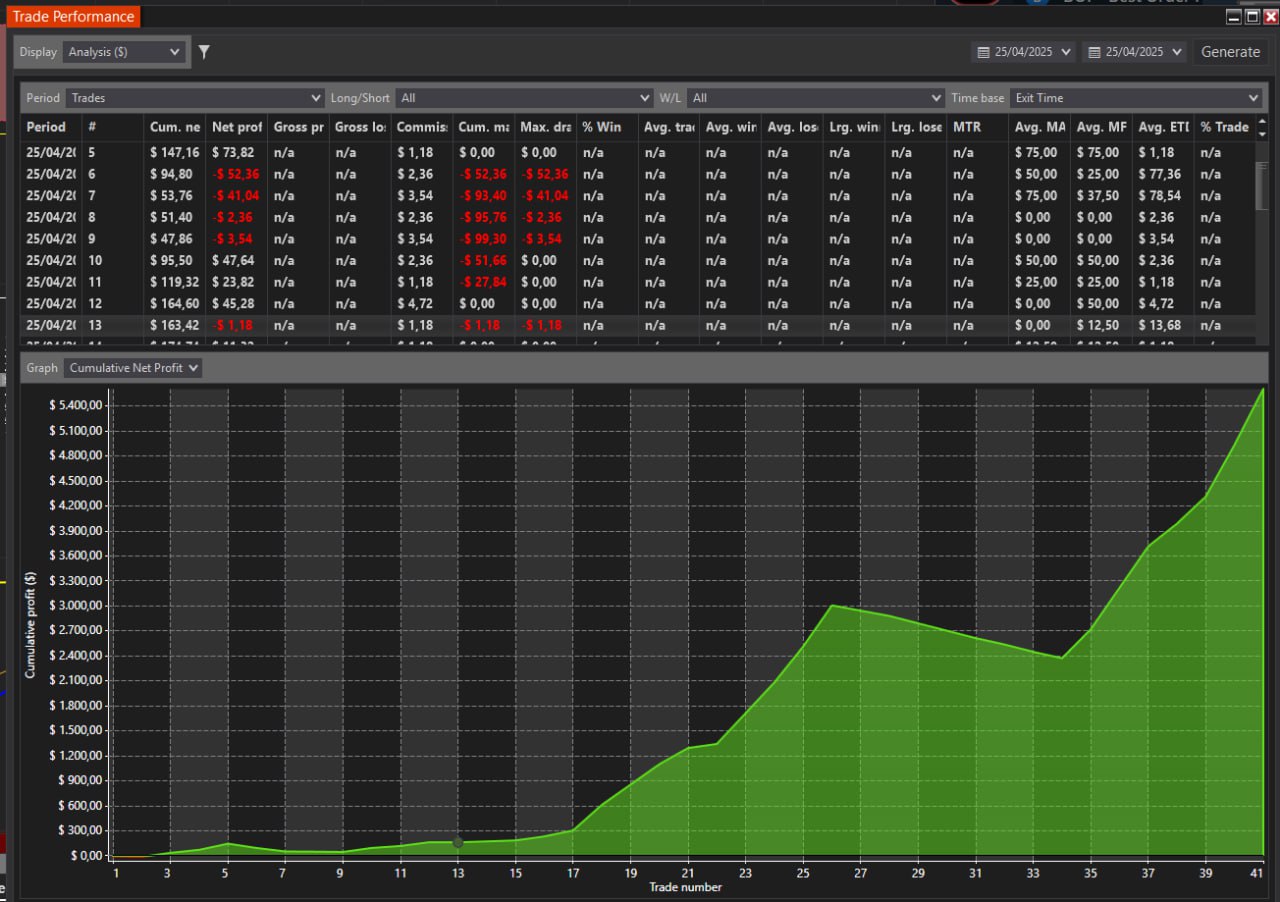
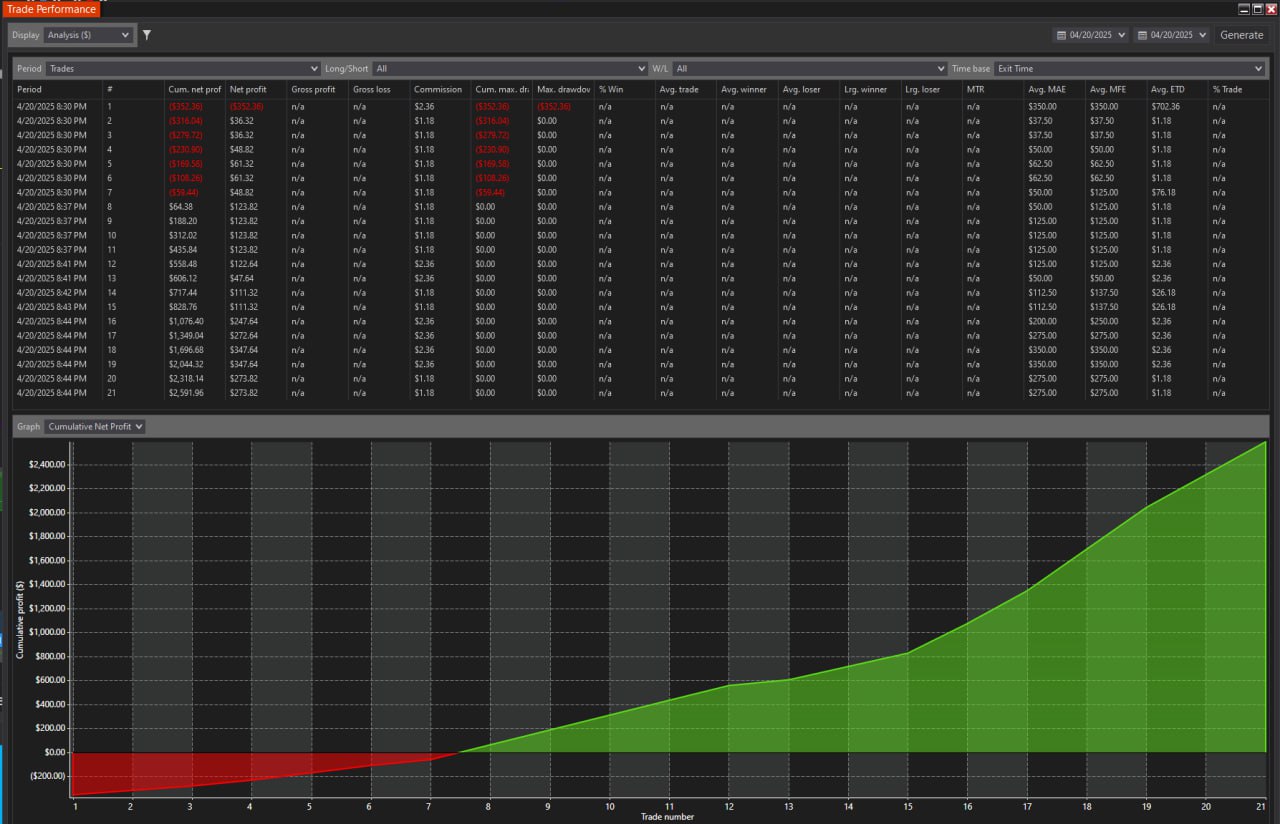
 I have passed one more funding account with Apex Trading today and made $3,000, which is the threshold for passing the account. I traded NQ, and the Bestorderflow indicators are excellent for passing props.