PACK 3 LEDGER INDICATORS
PACK 2 INDICATORS LINKS
(links open in a new window) :
Links for Pack 2 indicators: Passive side of orderflow:
- Live DOM (click to learn more):
- Pulling and stacking in a Live Dom
- Total Pulling and Stacking on a live Dom,
- Past DOM (click to learn more):
- Two-color heatmap
- Delta for Pulling and Stacking (horizontal indicator above footer).
- Dom - vertical histogram for level 2 passive orders
- Big Trades (click to learn more)
Based on level 1 data, aggressive orders by market:
Pack 3: The LEDGER package utilizes data level 2 for the HeatMap NT and PriceLinesNT
LEDGER (Bookmap NT) is a new version of the well-known Bookmap charting software for traders.
What is the difference between Bookmap and LEDGER?
What is the problem with the commonly used Bookmap software? Here are the Pros and Cons for Bookmap ( not this website)
Bookmap Cons:
- no longer unique and effective for scalpers
- outdated visualization
- Incorrect iceberg detection
- lack of traditional charting options
- not naturally integrated with NinjaTrader or any other platforms
- Hard-to-clean charts
- very primitive Dom
- lagging charts during high volatility
LEDGER, formerly known as Bookmap NT, is a new and redesigned version designed to address the shortcomings of Bookmap for traders.
Here are the advantages of LEDGER formerly Bookmap NT:
LEDGER PROs:
- New and Advanced: LEDGER Bookmap NT is a newer and more advanced version
- Direct Use: It is now used directly on the NinjaTrader chart.
- Integrated: LEDGER Bookmap NT is naturally integrated with any other indicators: Footprint, VWAP, Cumulative Delta, Volume Profile, Delta Level 1, and Delta Level 2,
- Visualization: improved to a new level
- Filters: for crispy, precise visualization and clean-up charts from tunnels and market makers
- Speed: LEDGER Heatmap is the fastest in the industry in terms of heatmap performance during high volatility times.
- Liquidity - enhanced liquidity and magnets filters
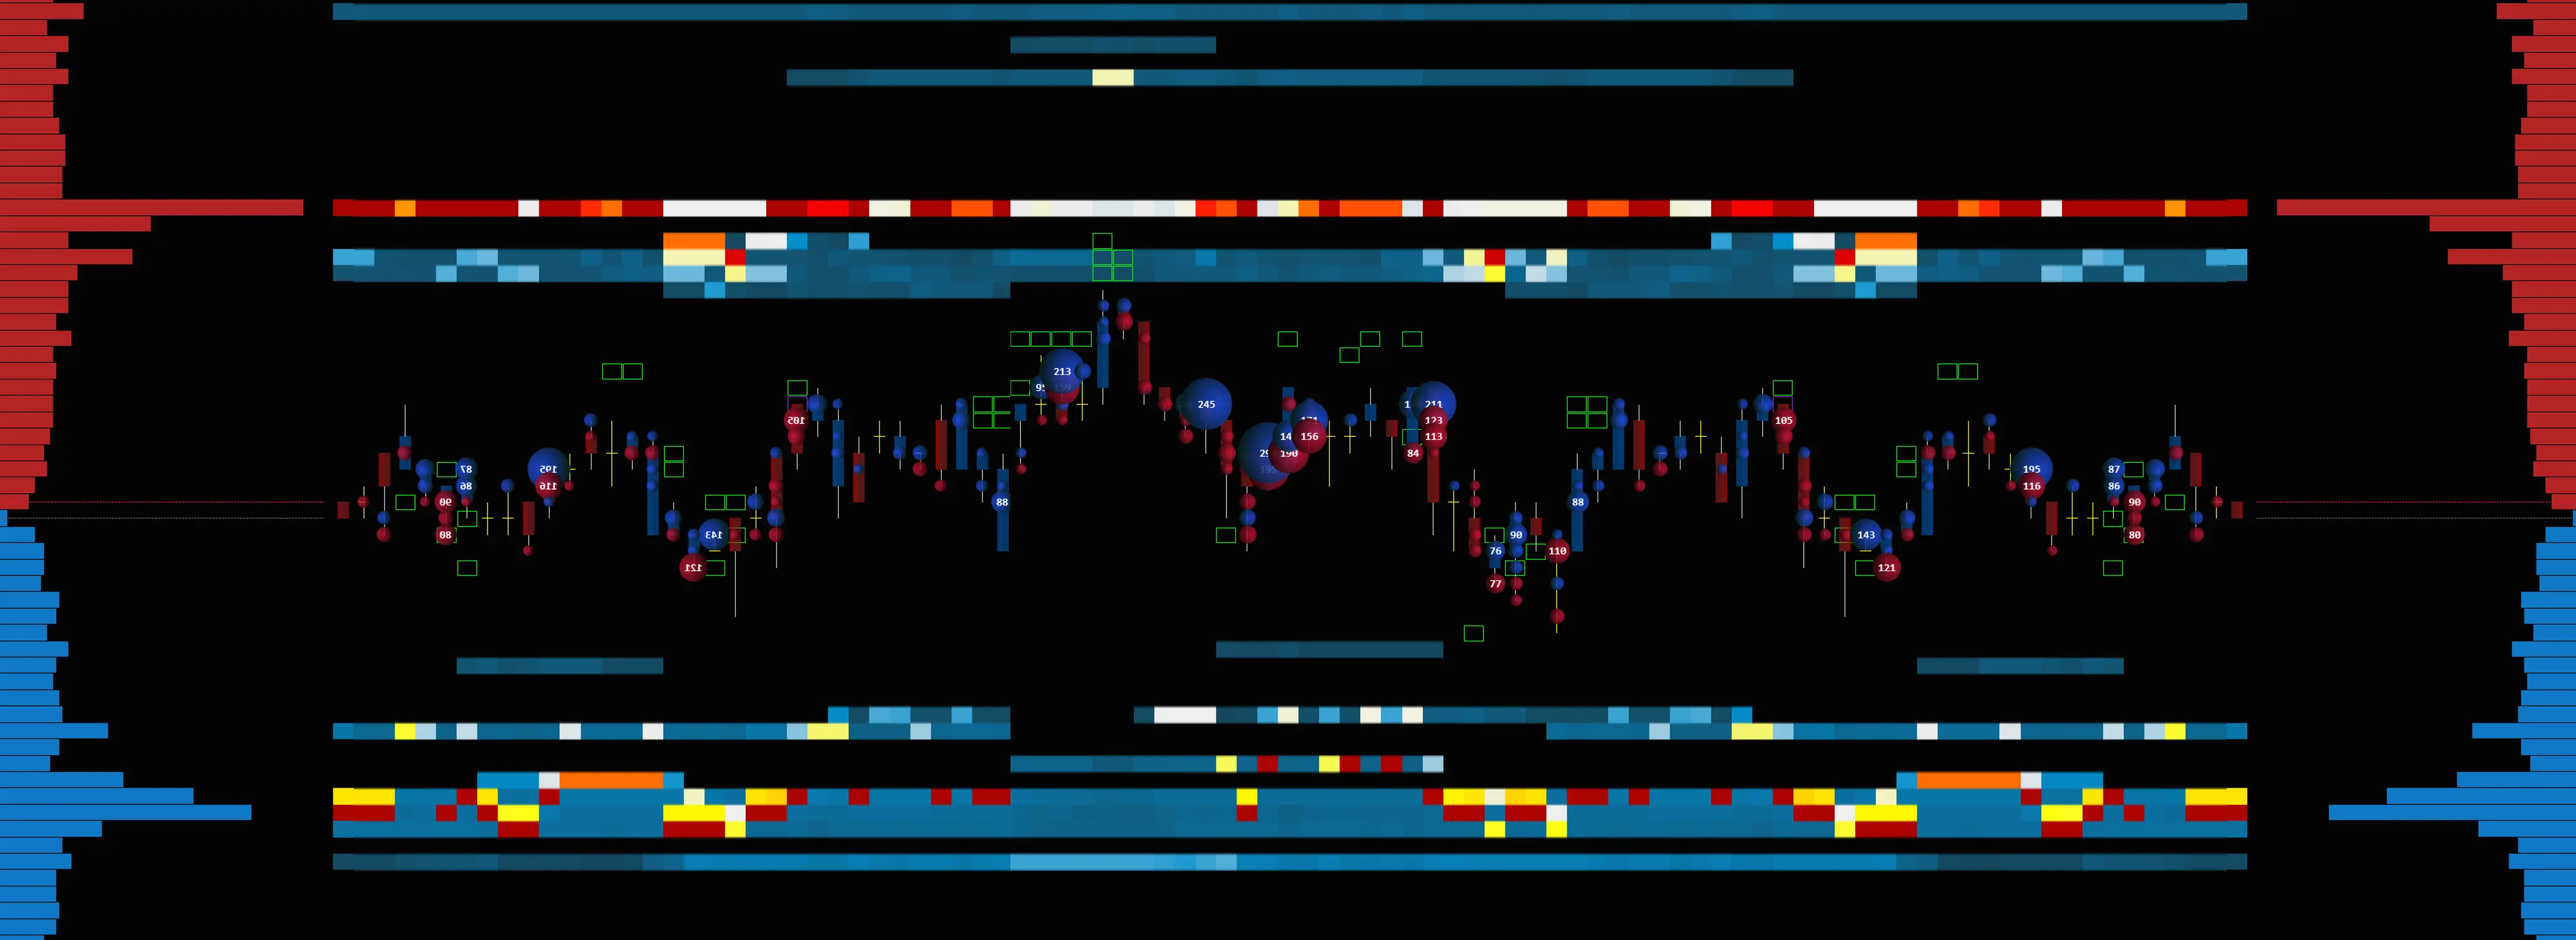
 What is Advanced Heatmap NT:
Heatmap NT displays historical records of passive resting limited orders, represented by time and colors. Heatmap NT displays liquidity and helps identify the strength of support and resistance price levels, as well as support and resistance zones.
Heatmap filters help to display immediate liquidity magnets for scalping and precision entries.
There is a lot of noise and insignificant volume orders on the ES that create a "tunnel" effect, which is impossible to remove on the Bookmap. Now, you can easily remove unwanted Market Maker noise with advanced filters on our Ledger Heatmap. This is an advanced feature not available on any other Heatmap indicators.
Market Delta indicator:
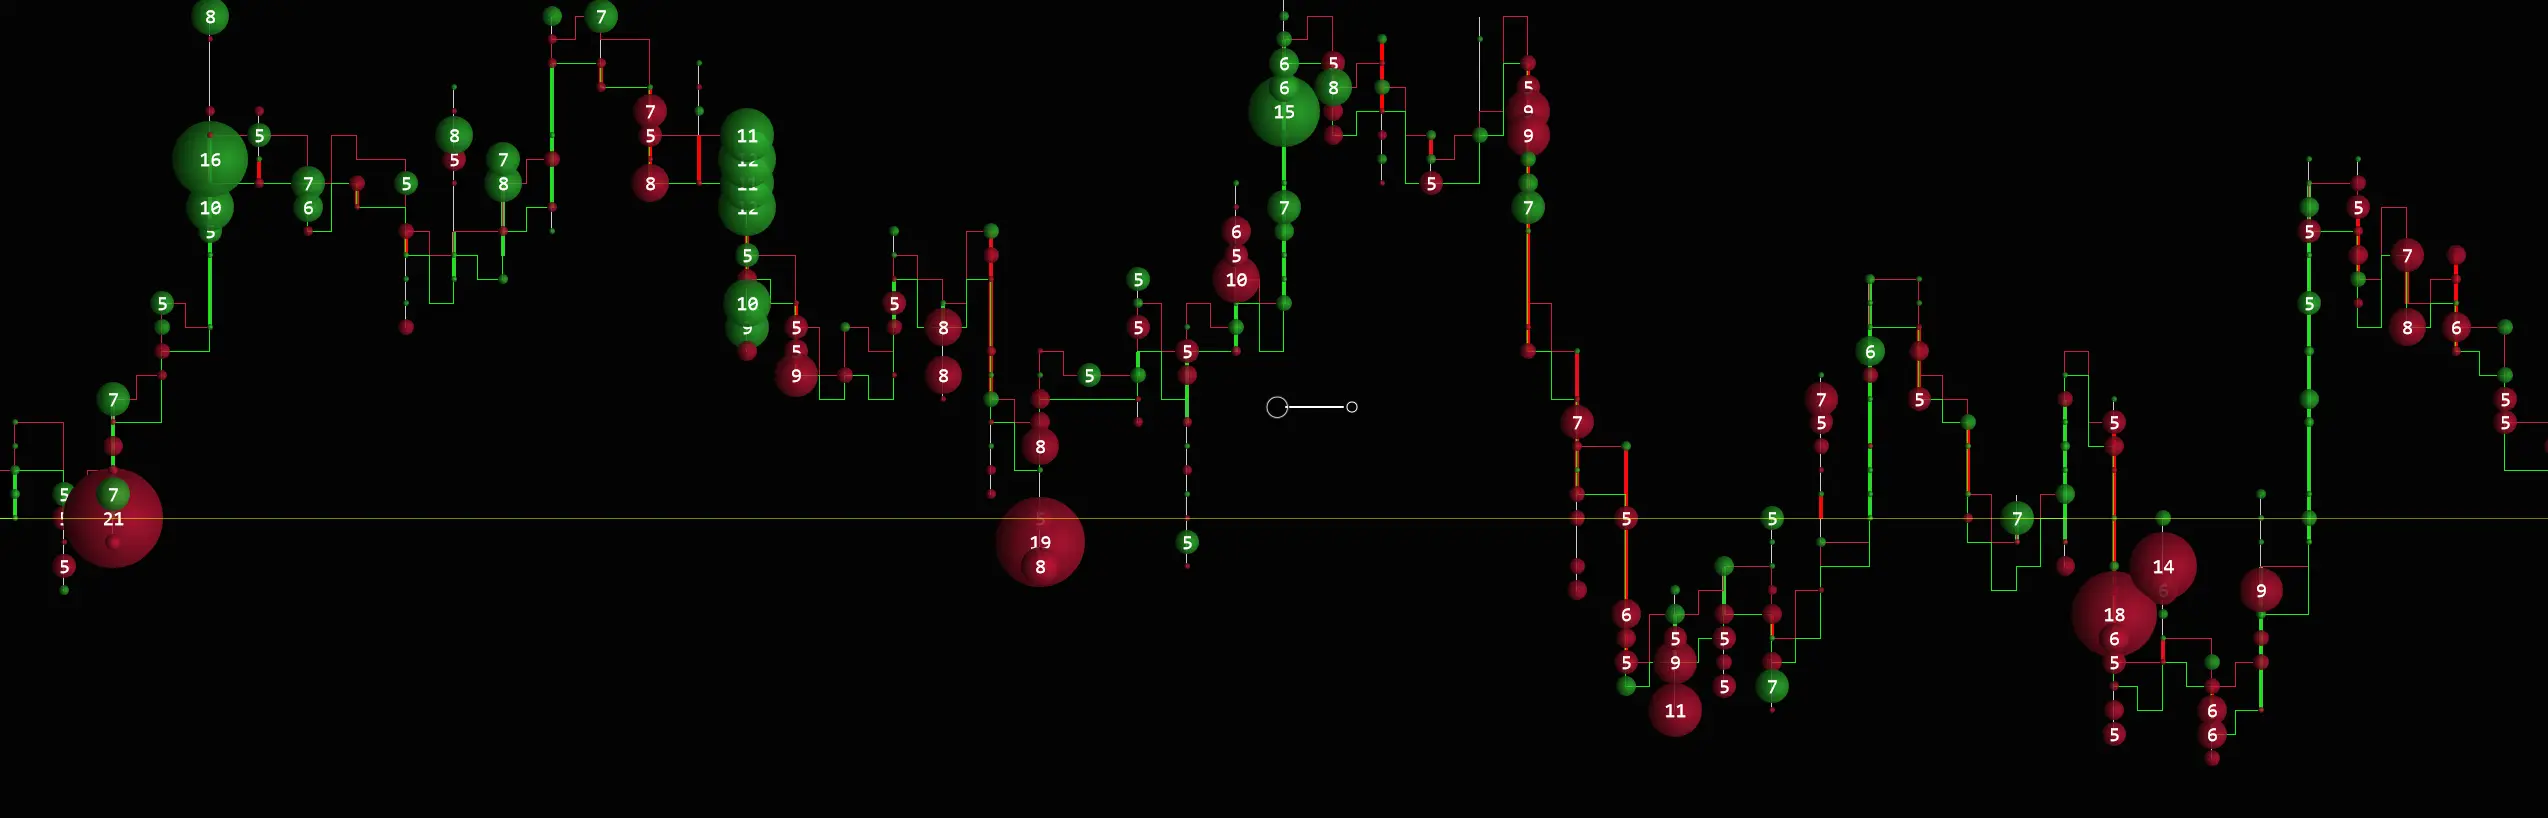
- Market Delta represented by bubbles, uses level 1 data. This indicator is similar to a Big Trades indicator. Big Trades display the volume of trades, but the Market Delta displays the winning side of that trade by delta. The total volume of that trade can be large, but it is unable to move the price and does not indicate a stronger side. Market Delta displays immediate results of interaction between orders on level 1 and level 2 - between aggressive and passive sides of the market as a delta (difference) in the moment of that transaction. The delta shows the stronger side of the market.
Market Delta can recalculate bubbles in real-time. As soon as you make chart adjustments, it adjusts its bubbles to the optimal size and view. There are two modes of recalculation, and this is an advanced feature of BestOrderFlow that is not available on any other "similar-looking" indicators.
Market Delta indicators are significant for visualizing absorption and multiple absorptions.
Market delta bubbles can be merged using two merging modes, allowing the chart to be fine-tuned for optimal readability and instant analysis.
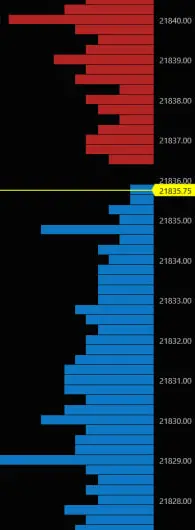
Live DOM - is Live Depth of Market -(DOM)
LEDGER's Live Dom is a very simple level 2 data histogram representing a DOM passive/ limit / resting orders.
It is Live orders that have not yet been executed due to price and aggressive matching orders.
This is a visual presentation of total data orders on each price level. Some Live DOM orders are real and triggered by price, and some orders are hypothetical and can be removed.
Removing and adding orders on a DOM is known as pulling and stacking.
Live Dom includes Market Maker orders responsible for market protection and providing immediate liquidity on the book to aggressive side of orderflow market participants. It also includes institutional and large orders, as well as orders used for manipulation and flipping.
Live Dom should be used along with a Footprint or Market Delta indicator ( Market Delta is a part of an LEDGER package).
Indicators like Market Delta or Footprint display interaction between orders on level 1 and level 2 and signify the actual involvement of passive level 2 orders that are not being removed from the Live Dom histogram.
Keep in mind that indicators working with data at level 2 are more resource-intensive for your machine's CPU compared to indicators processing level 1 data. Keep numbers instruments running and indicators processing data at level 2 to a minimum, especially at the beginning of the American Session - NY open.
PriceLinesNT
What is the PriceLinesNT advantage over other price lines?
The advantage of the PriceLineNt becomes obvious when trading on a millisecond time frame, particularly with high-frequency trading and script automation.

PriceLinesNT keeps the bid and ask at every point of price movement intact.
PriceLinesNT is based on Level 2 data and displays close-limit orders that are ready to be triggered by aggressive market orders. The best buy can be entered as Buy by Bid, and the best Sell can be entered as Sell By Ask. That gives an advantage over entering the Buy Market and Sell by Market.
The history of PriceLinesNT can be recorded, and entries and exits can be analyzed for further insight. PriceLinesNT is an excellent addition for scalping with granular precision.
LEDGER PRESENTATION
Watch the presentation about Indicators from Pack 3 on the main menu LEDGER https://bestorderflow.com/bookmapnt
PACK 3 LEDGER STRATEGIES:
Strategies used with indicators from the LEDGER ( formerly Bookmap NT) in combination with other bestorderflow.com indicators
VIDEO + PDF MANUALS AND INSTRUCTIONS
Manuals / Instructions / Explainer about how to set up Heatmap, Heatmap Filters, Market Delta
Compare old Bookmap and new LEDGER from bestorderflow.com
2
Video 1: Step By Step Tutorial - how to set up and tune Heatmap on any timeframe and any instruments.
Video 2:
Russian language Heatmap User Manual Play List link
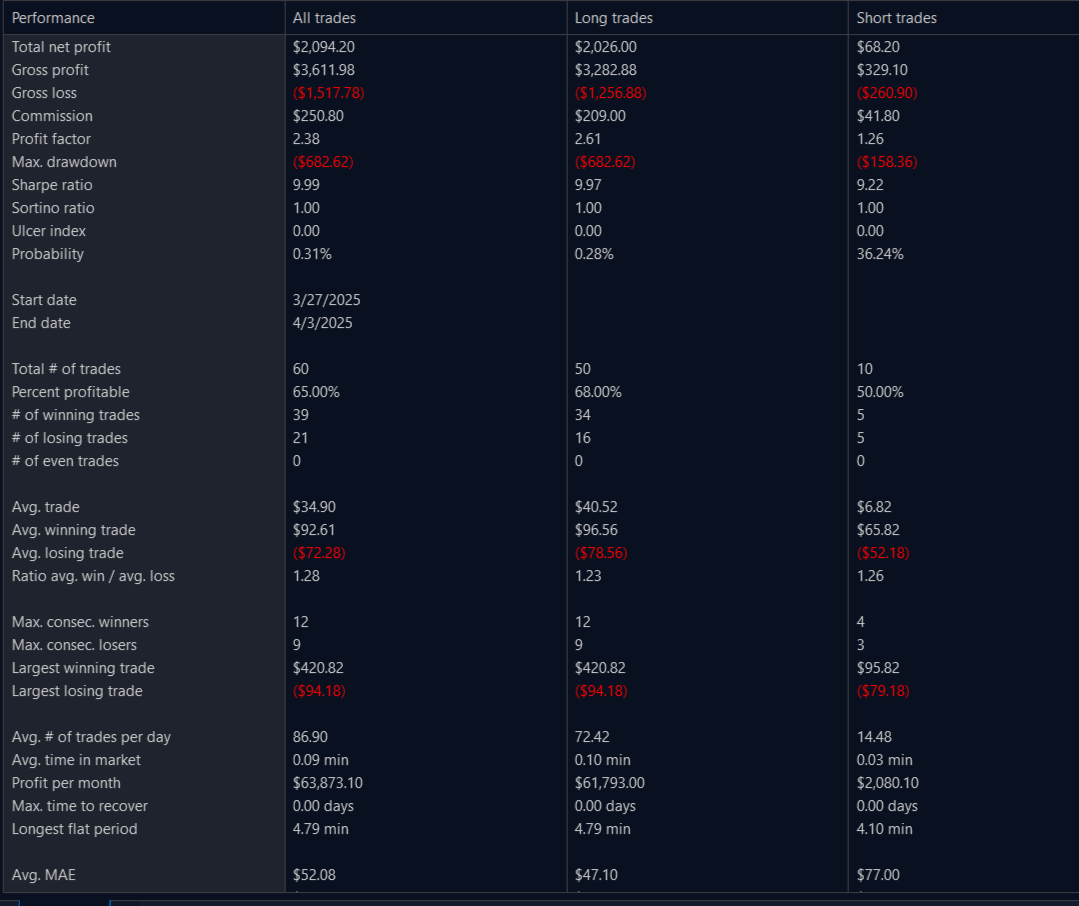
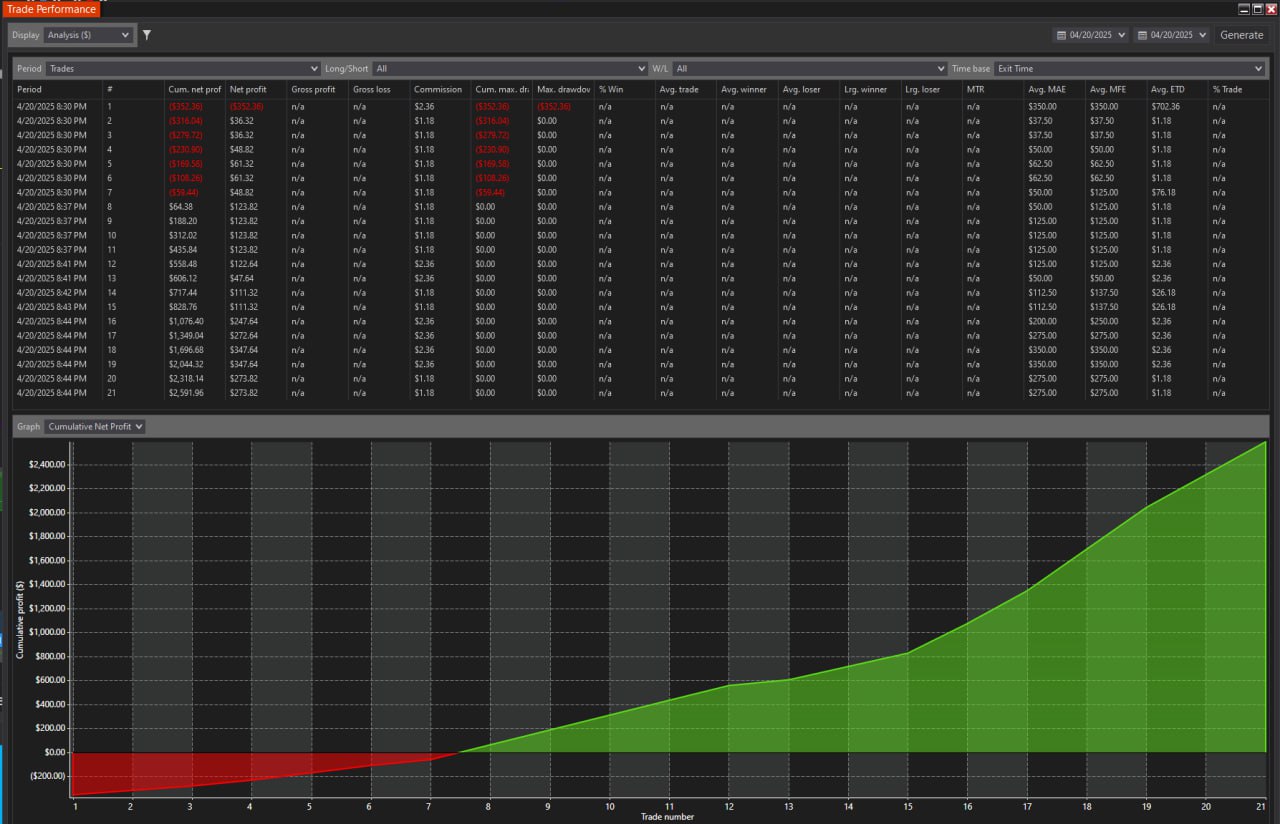
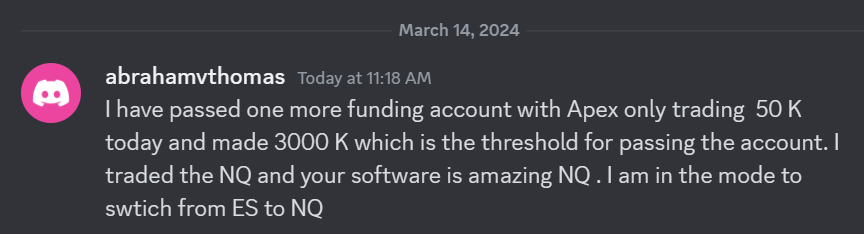 I have passed one more funding account with Apex Trading today and made $3,000, which is the threshold for passing the account. I traded NQ, and the Bestorderflow indicators are excellent for passing props.