abrahamvthomas
Verified user
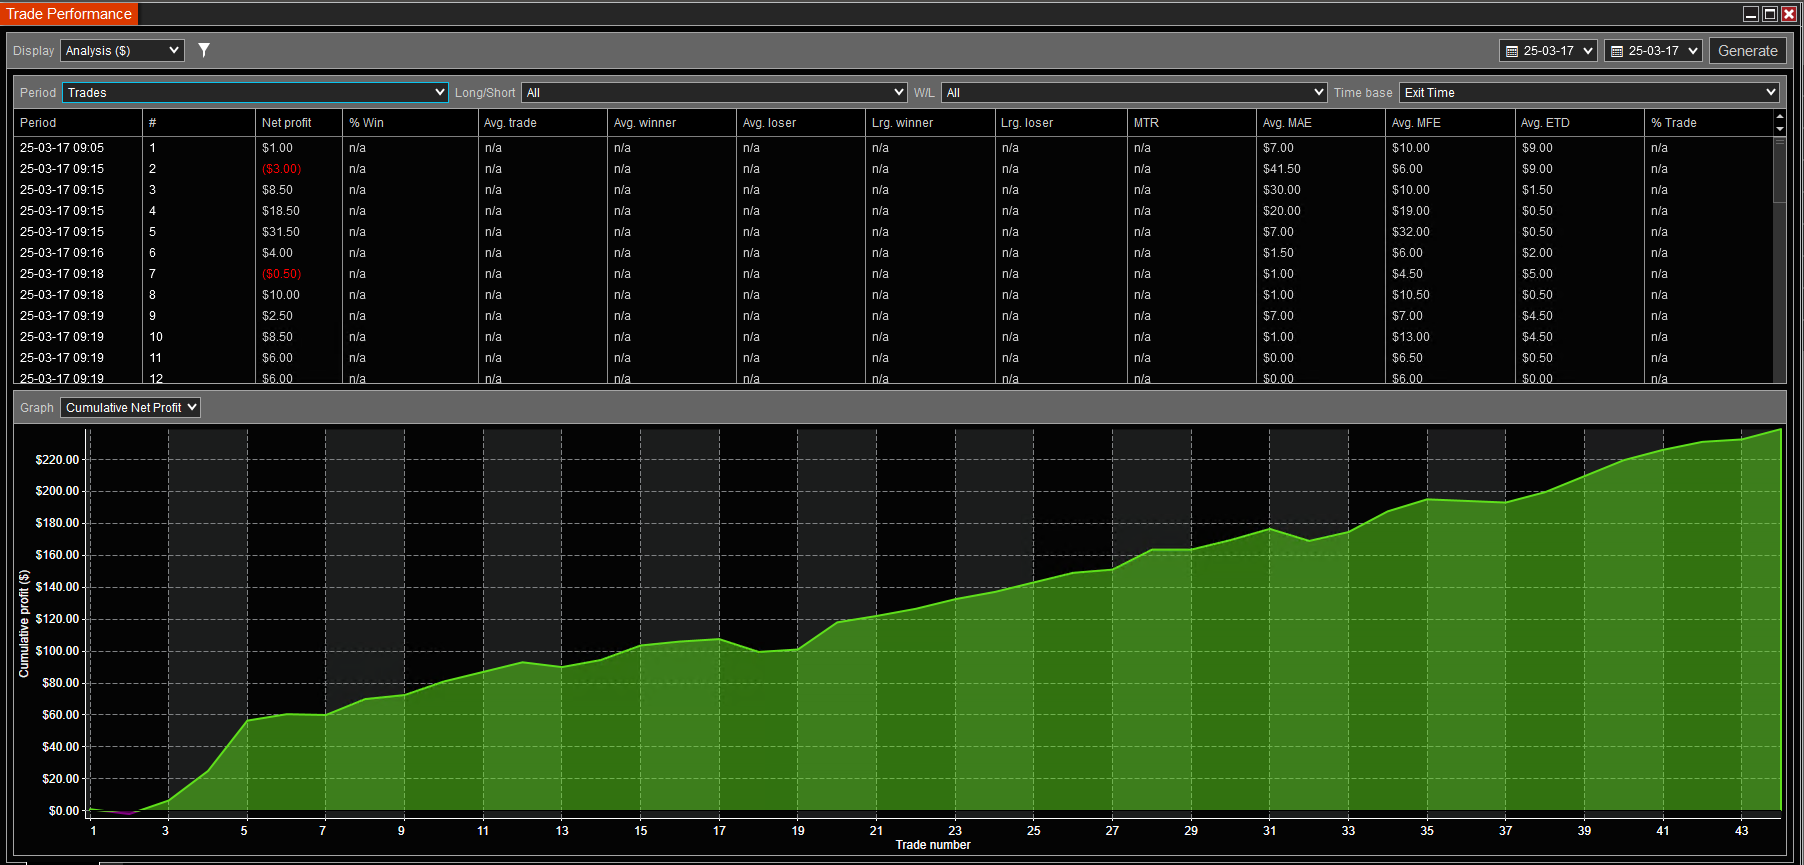
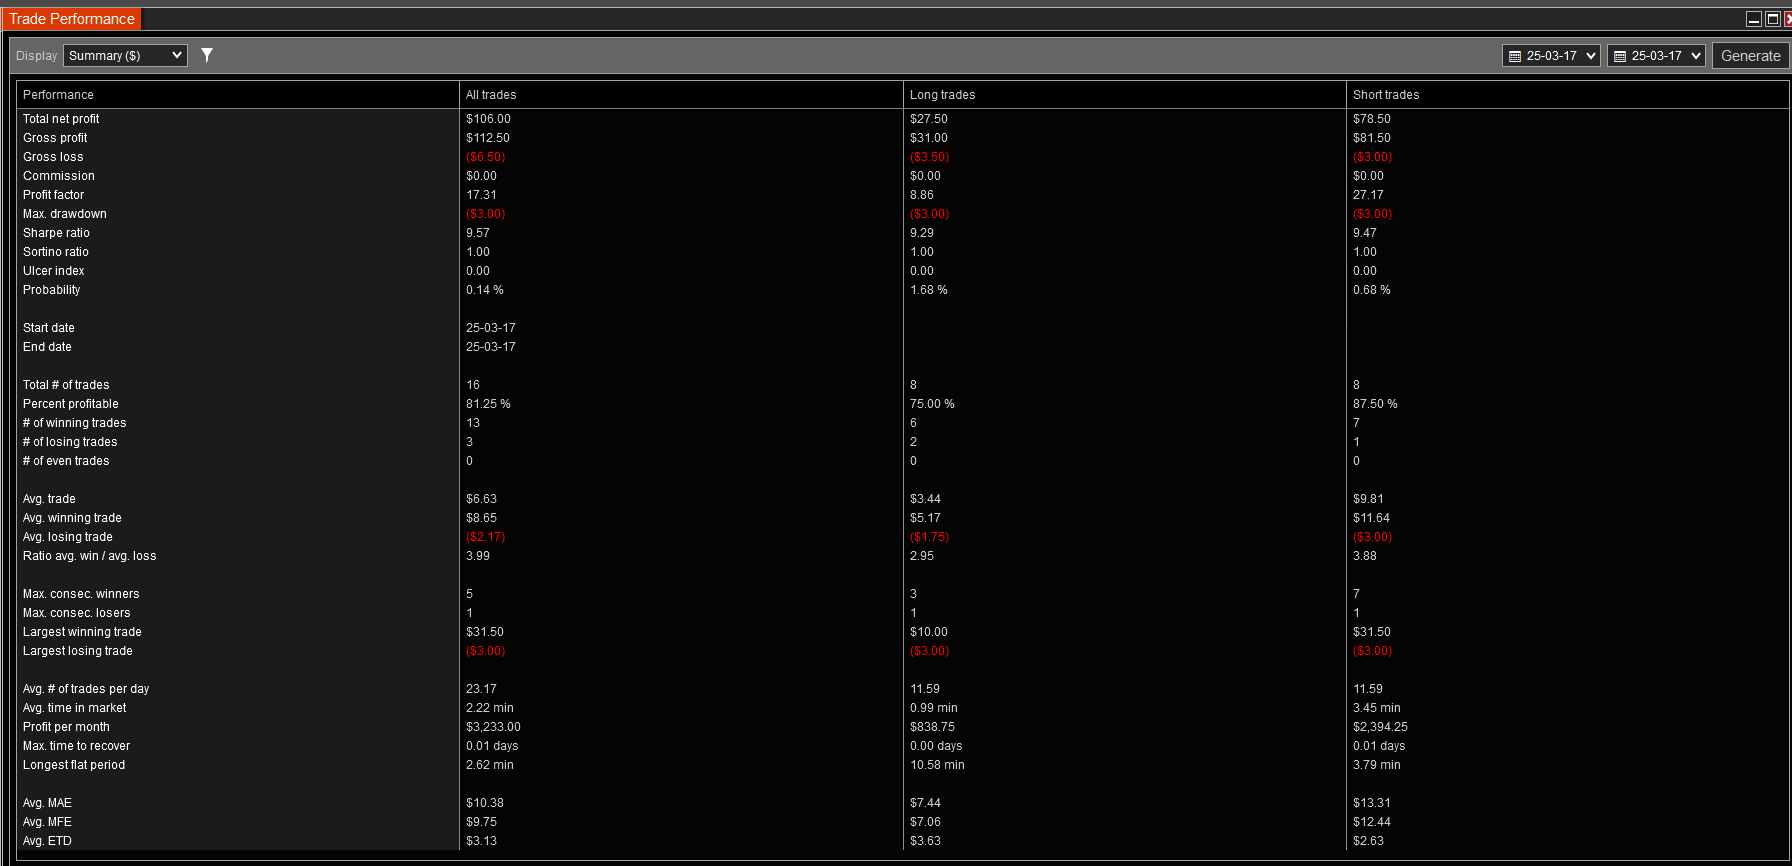
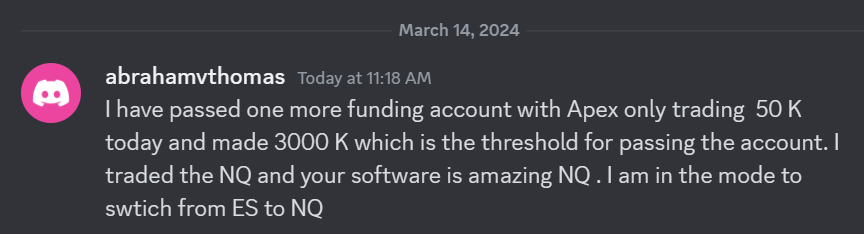 I have passed one more funding account with Apex Trading today and made $3,000, which is the threshold for passing the account. I traded NQ, and the Bestorderflow indicators are excellent for passing props.
Garban
Verified user
The MBO Market By Order indicator displays liquidity in real-time. Now I can see if a Support or Resistance Level can hold or become weak.
Fortunate
Verified user
5minutes of trading 1305-1310 GC ES NQ 15s chart with MBO max DCA 2 contracts open. Done for the day
Leandro
Verified user
I have tested and used indicators from many other vendors. The BestOrderFlow indicators are the best set of indicators for the NinjaTrader platform. It is lightweight and presents information in a visually appealing manner. That makes a lot of difference in my trading. I love to trade with MBO Market by Order indicator. Feel free to connect with me, and I can provide you with hundreds of screenshots of my results, if you'd like.
Game Changer for my Results
Fortunate. Verified user.
As an active trader, I can't say enough good things about the BestOrderFlow Delta Level 2 indicator. This set of indicators gave me an edge in my trading. It's like having a crystal ball for market movements! The way it tracks the speed of buyers and sellers is incredible. I love how it shows who is dominating the market in real-time, which helps me make informed decisions quickly.
Whether it's spotting a reversal or riding the momentum, this indicator has been a game-changer for my scalping strategy. The visual cues are straightforward to understand, and the ability to adjust settings based on different trading sessions is a significant advantage. If you're serious about trading and want that extra edge, this indicator is a must-have. Big shoutout to BOF Admin support and the team for making charts so easy to use and keeping NinjaTrader with BOF indicators super fast and responsive! Your work has truly made a difference in my trading experience. Thanks a ton!
DM me on Discord for any questions. and see my results.
Dan Alec
Verified user
Feel the Difference
I am a trader with over 6 years of experience trading volume indicators on NinjaTrader. Other third-party vendors that sell indicators for NinjaTrader are known for their poor quality and the difficulty of using their indicators, which can cause charts to become slow and sluggish.
I no longer use any other third-party indicators, except BestOrderFlow (BOF). BOF indicators are made professionally, and you can instantly feel the difference.
Charts with BOF indicators run much faster and never freeze.
BOF has several simplifications over its competitor's footprint, which I appreciate. It is not only lightweight, but it just works flawlessly.
BOF tutorials and educational videos are very informative and helpful.
Regarding charts with BOF indicators, I appreciate how the information is organized and visually presented on the indicators.
Welcome to connect with me on Discord.
Momentum trader
Verified user
Unparalleled Quality and Speed
I have been testing BOF indicators for two months and getting shocking results. I am thrilled and excited as never before to trade. I am honest and have no financial incentives to influence my expression.
This Footprint is incredible. This Footprint indicator uniquely combines several other indicators, offering unparalleled quality and speed.
It's a testament to the programmer's expertise behind it, and I hold it in high regard. Yes, I am deadly serious in my feedback on using these indicators.
My primary motivation for writing about BOF indicators is my sincere desire to help traders grow their accounts faster. I have tested and used many indicators from other well-known brands and found that BOF indicators perform more efficiently, providing a significant advantage in trading.
Ed Garcia. 2025
Verified user.
My favorite indicators
I fell in love with BOF indicators from the very first day of use, and I highly recommend them to any trader.
I traded the S&P 500 and Nasdaq for 4 years and used BestOrderFlow indicators for 12 months.
Through the use of BOF indicators, I achieved a significant improvement in my trading results.
The visual presentation of the complex data provided by bestorderflow indicators helped me to make my entries and exits much faster and safer than ever before.
Charts with BOF indicators run much faster and are very informative. In my day trading, I use BOF Footprint, Market Speed, Delta Profile, Pulling and Staking on Dom, Heatmap on the past Dom.
I use BOF video tutorials and PDF manuals to set up each indicator the way I need for my trading setups.
Please feel free to contact me if you have any questions.