FOOTPRINT DEFINITION:
What Is a Footprint Indicator in Trading?
FOOTPRINT IS THE AGGRESSIVE SIDE OF ORDERFLOW.
In trading, the term "footprint" refers to a visual display of aggressive orders by market. Footprint is an aggressive side of orderflow for market participants' orders. Footprint record orders by "de facto" - already happens and is executed in time. Footprint displays aggressive order activities because the orders executed on the footprint are entered out of desperation, with a slight instant loss.
Aggressive buy orders by the market do not result in purchases from market sellers. And aggressive sellers by market never sell to aggressive buyers by market. The orders of aggressive participants interact only with passive limit orders waiting on the other side of the order flow.
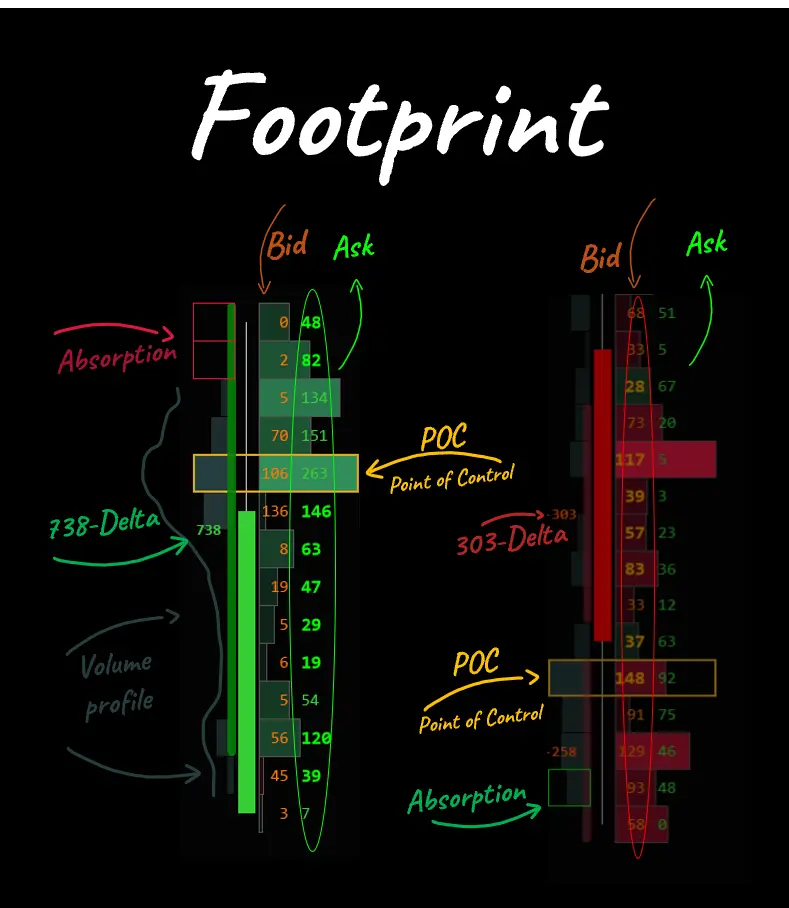
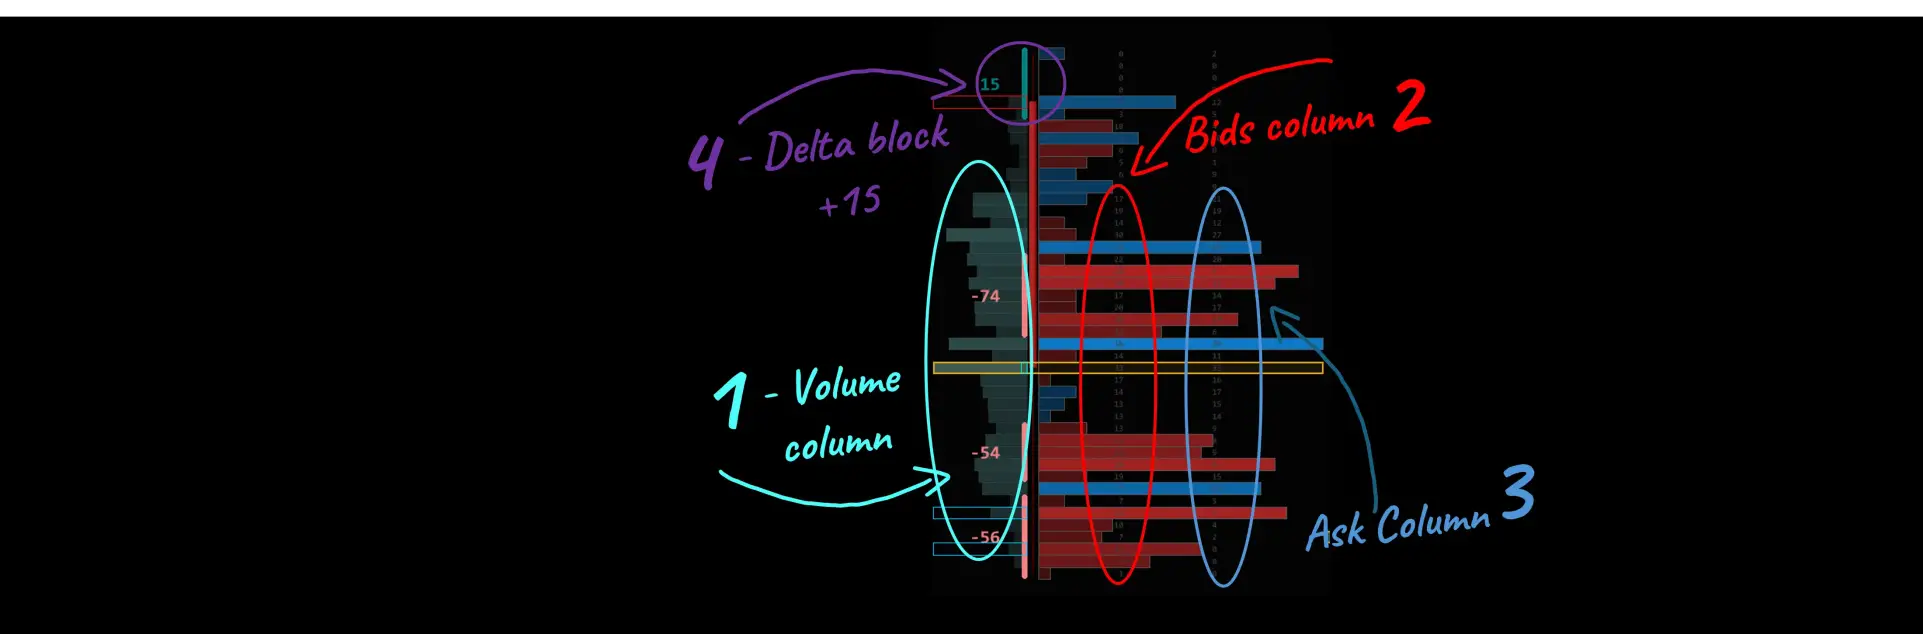
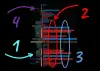
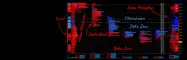
Here is how basic Footprint looks: bid/ask on the right side of the candle, delta blocks on the left side of the candle, volume profile on the left, POC (point of control), absorption, Imbalance zone, and single imbalances.
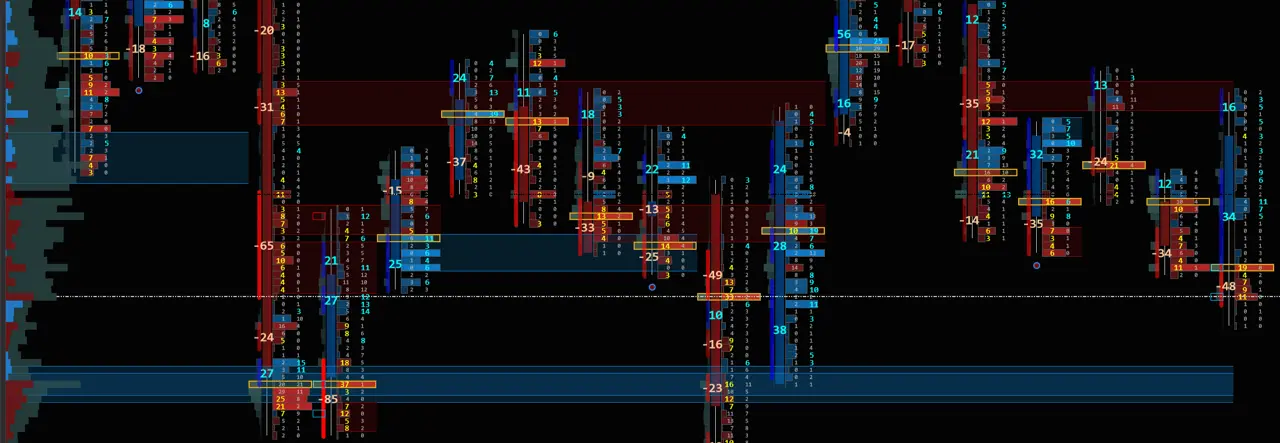
A new type of Footprint is more visual.
Footprint is an Aggressive volume indicator that displays orders executed by Market participants. The data used is level 1 data. Rhythmic level 1 data is the recommended data provider.
FOOTPRINT DEFINITION:
Footprint primary purpose and definition - what is Footprint?
Footprint records buying and selling activities at each price level. It is a ledger for sales orders, as well as bids and buy orders, which are represented as asks. Each order print is its size in volume, and the number of orders in a lot. In simple terms, a Footprint is a visual display of an asset's accumulations and distributions.
Footprint data is presented in various formats. Based on footprint data, we can interpret the exhaustion of buyers or sellers, a change in trend, absorption by buyers or sellers, imbalance, clusters, and cluster zones that become support and resistance.
FOOTPRINT OLD SCHOOL VERSUS NEW SCHOOL
The old school of a Footprint chart resembles an Excel table with candle bars. 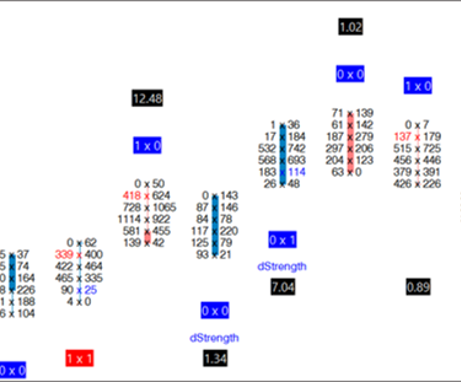 The old school footprint looks like ExcelThe old school of a Footprint requires a lot of mental energy to process and analyze the order flow and the activities of buyers and sellers.
The new type of Footprint presents complex data in a simple visual way, allowing traders to make analyses quickly and easily, without complications. The Footprint from BestOrderFlow is a new generation, a new school of data presented in an easy-to-read format, to facilitate trading decisions for traders.
PURPOSE TO USE FOOTPRINT CHARTS:
- Footprint provides a deeper X-ray view inside a candle bar.
- Footprint provided better insight into market dynamics compared to traditional candlestick charts and price action analysis, such as Smart Money Price Action.
- Footprint provided help to traders understand the real reasons behind price movements based on solid data, rather than relying on guesswork.
- The footprint chart is utilized by day traders, swing traders, and scalpers in intraday trading.
BASIC ELEMENTS OF A FOOTPRINT:
 Footprint present Level I data includes volume and size at a price:
Best Bid and Ask Prices: The highest price a buyer is willing to pay (bid) and the lowest price a seller is willing to accept (ask).
Bid and Ask Sizes: The number of shares, forex lots, or contracts available at the bid and ask prices.
Last Trade Price and Size: The price and number of shares, forex lots, or contracts involved in the most recent transaction.
Volume: The total number of shares, forex lots, or contracts traded during the current period.
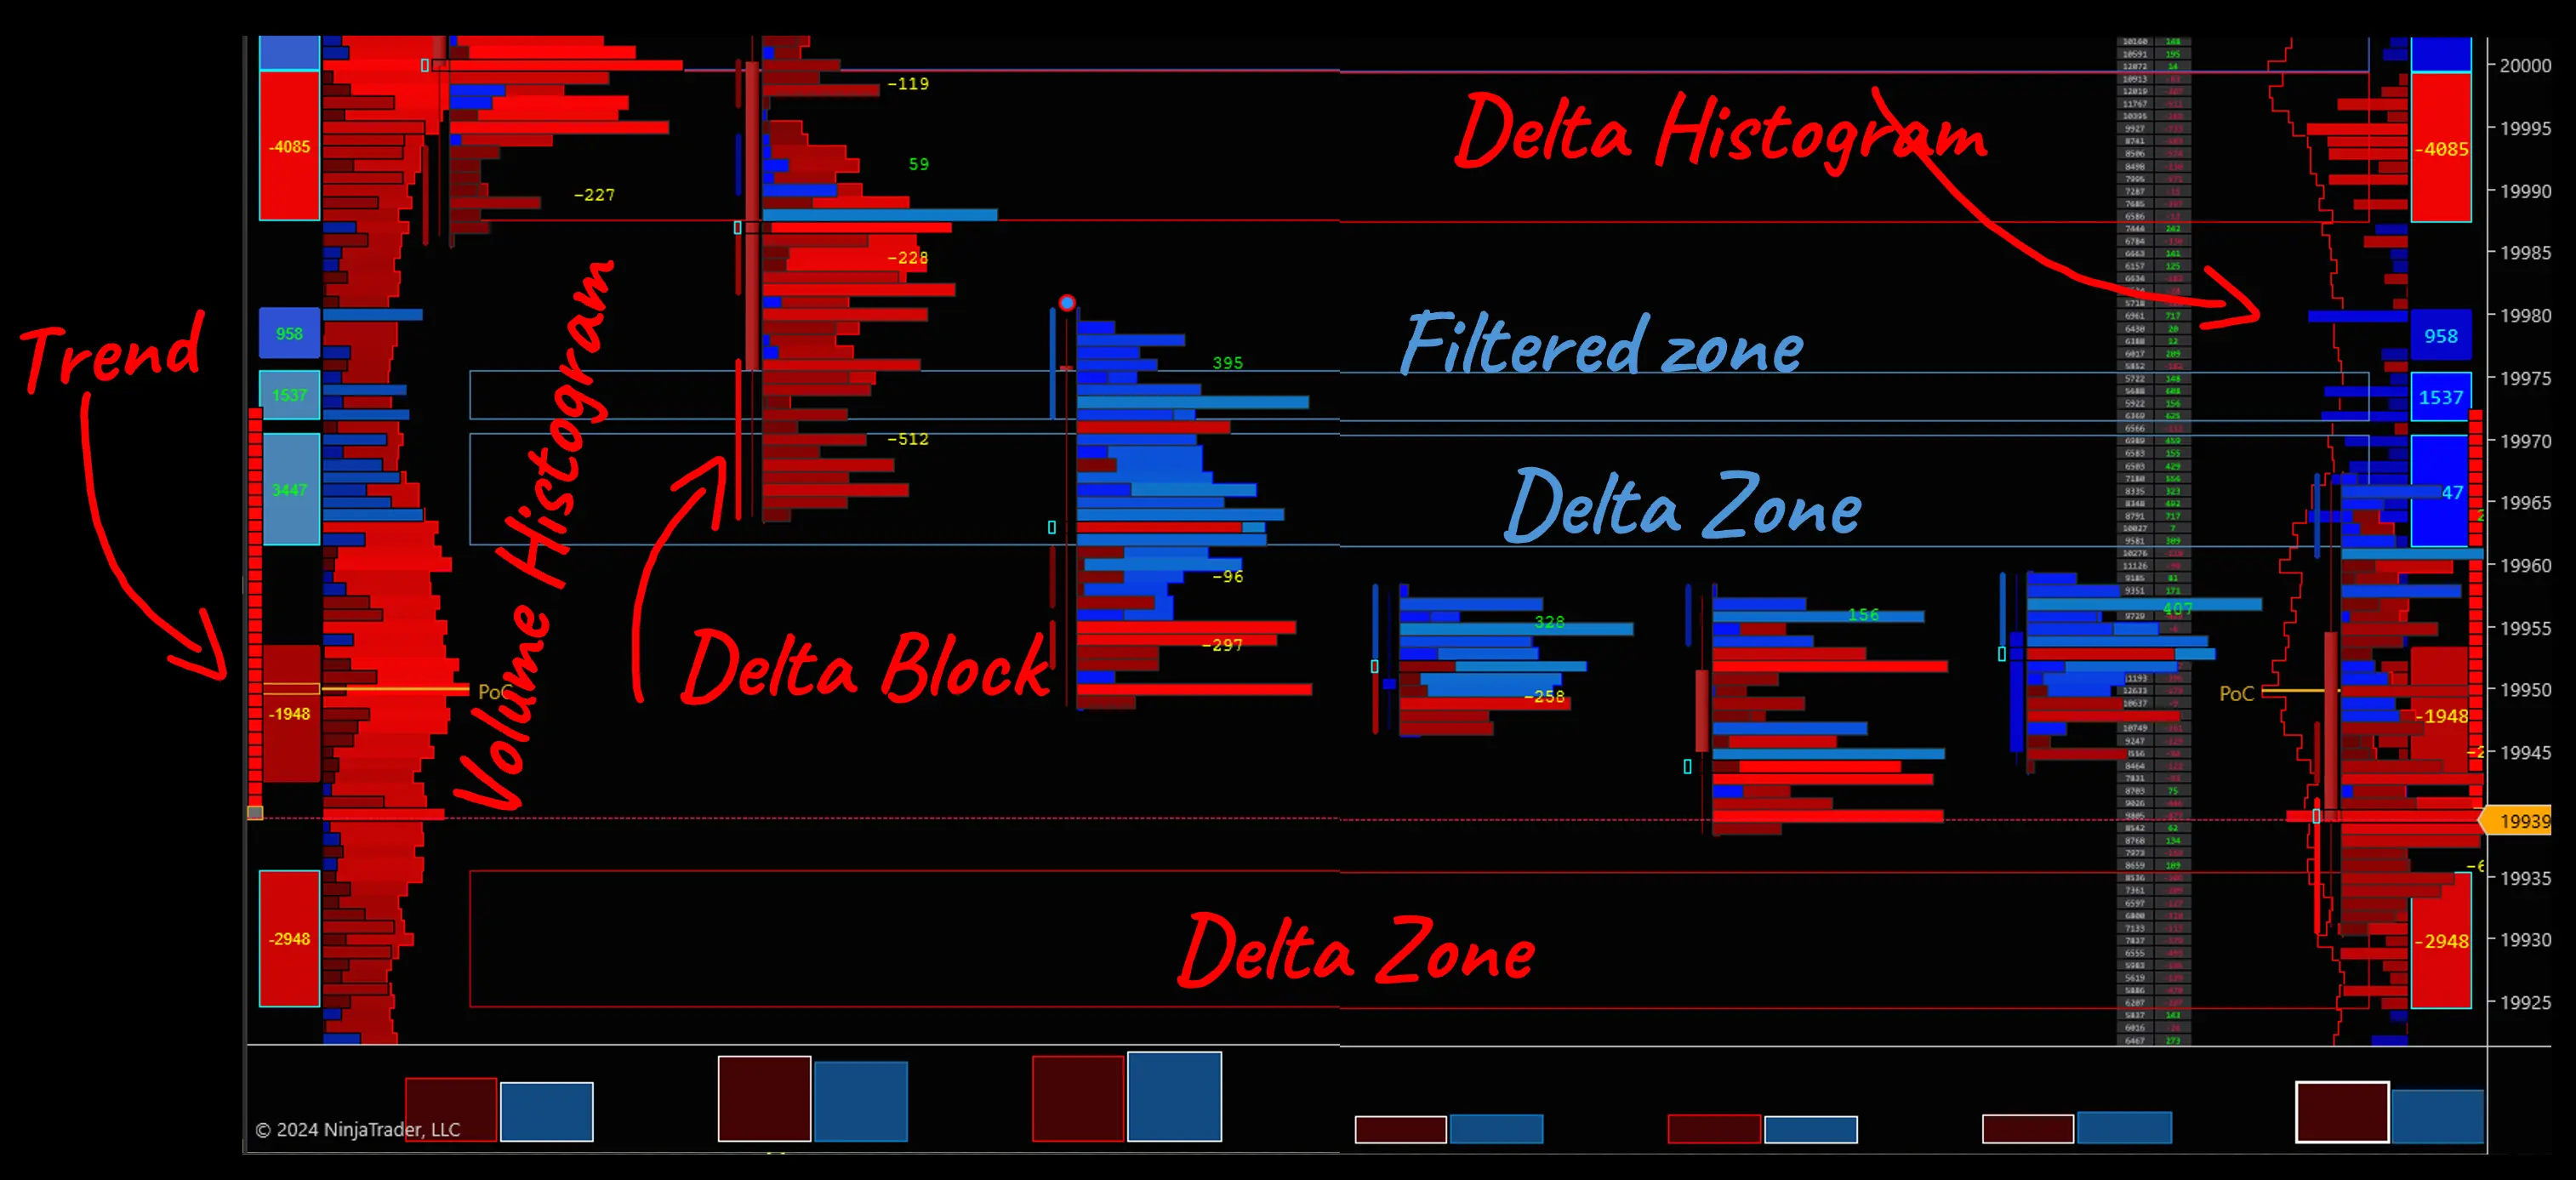
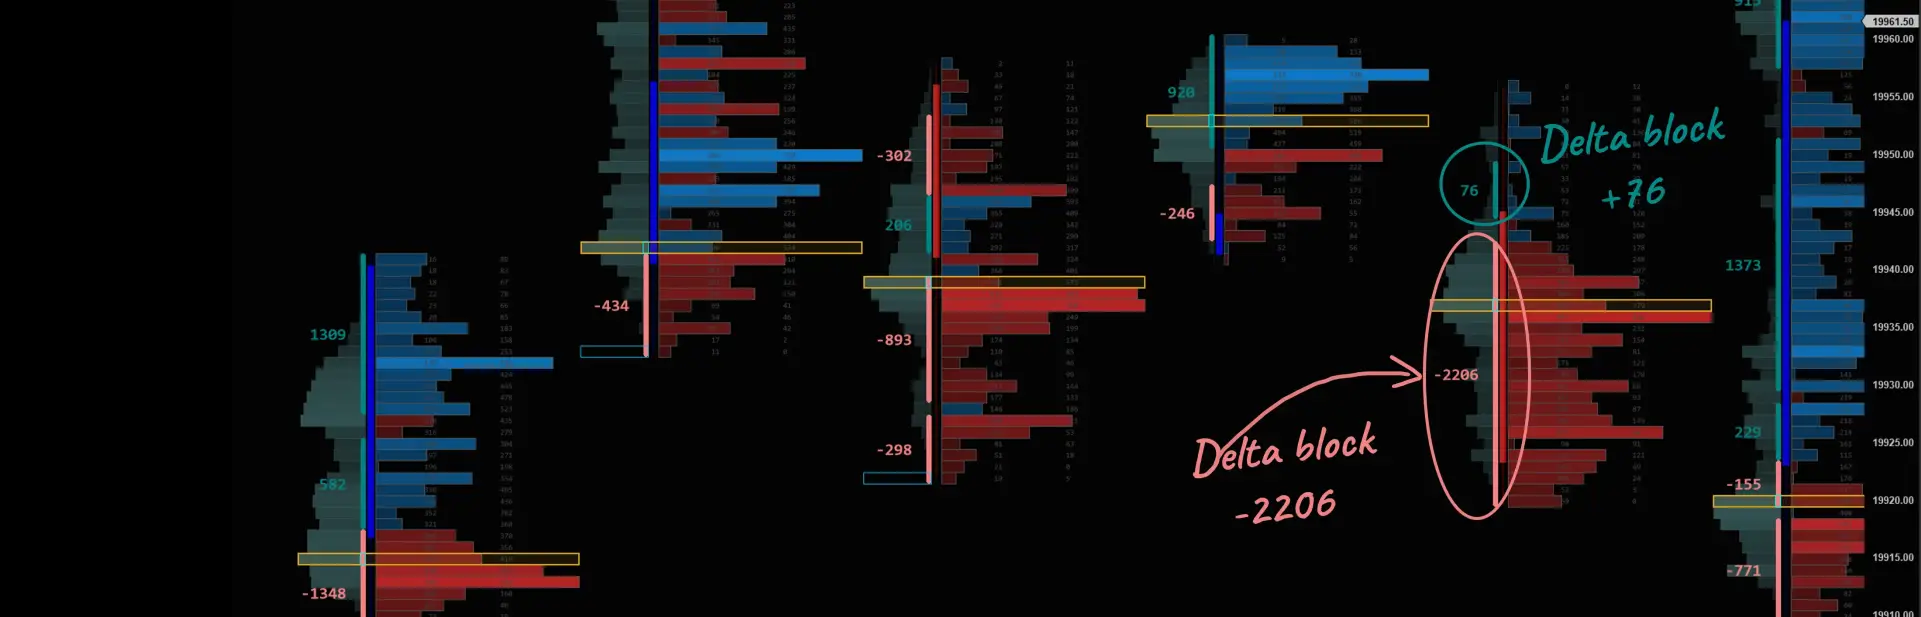
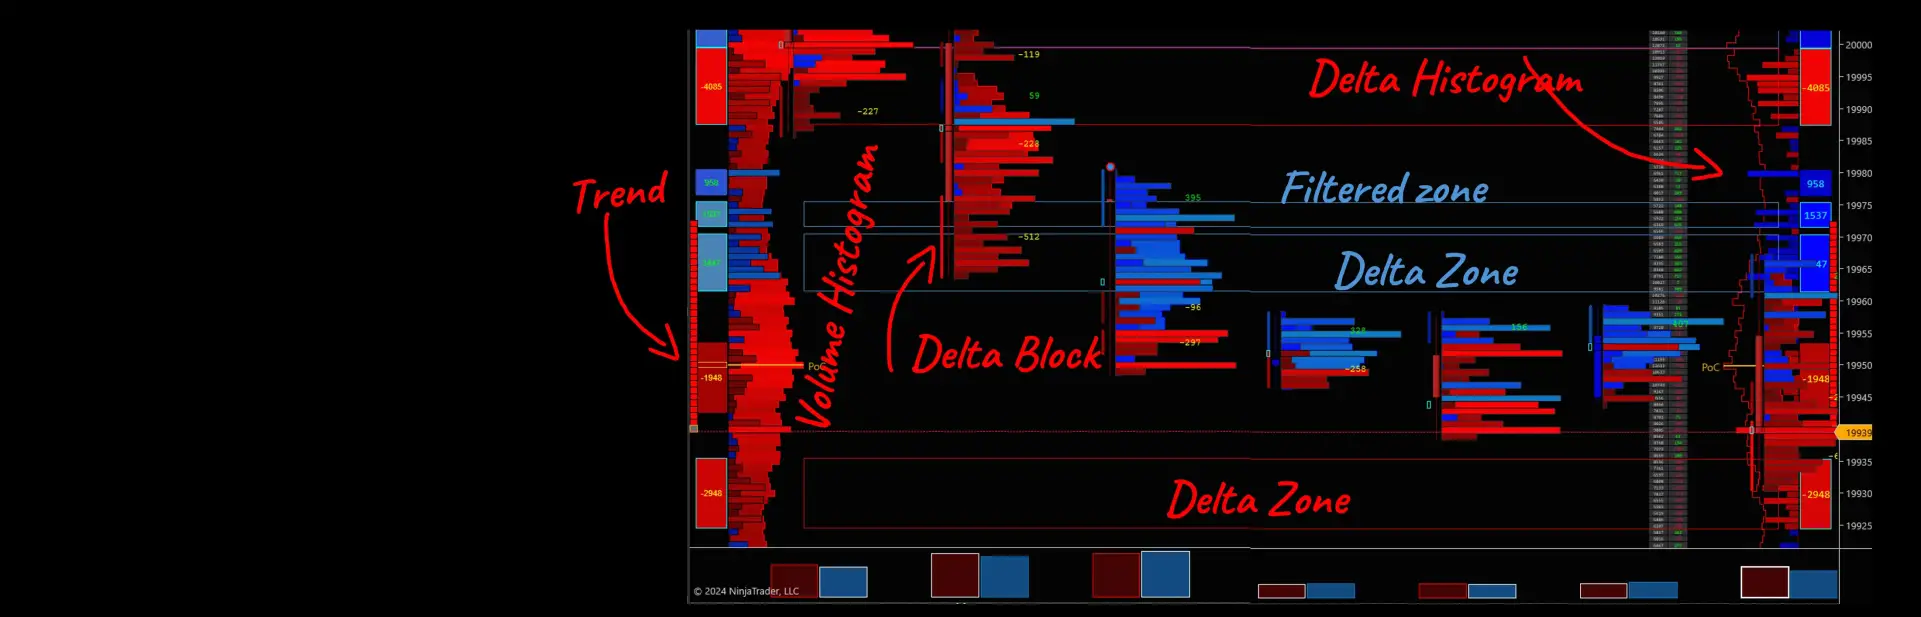
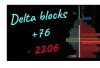
Delta and Delta Block: The Difference between the ask and bid volume on a footprint is a delta. Delta indicates whether buyers or sellers are more aggressive and more likely to win at that price level. Deltac Block is a real-time delta shown alongside a developing candle bar. It shows an instant change in delta.
Notice left of a candle bar, an additional rectangle block ( green or red semi-transparent) that is shorter than the candle bar. This is the Delta block inside the candle.
The old-school footprint position total delta, which is displayed above or below the candle, is shown in the footer (below the chart) after the bar closes. To see the old-school Delta, you have to wait until the bar closes. That is not convenient and takes extra mental power to search for the delta information and wait for the bar to close. The summary or Total Delta is lacking the price at which that delta accumulates.
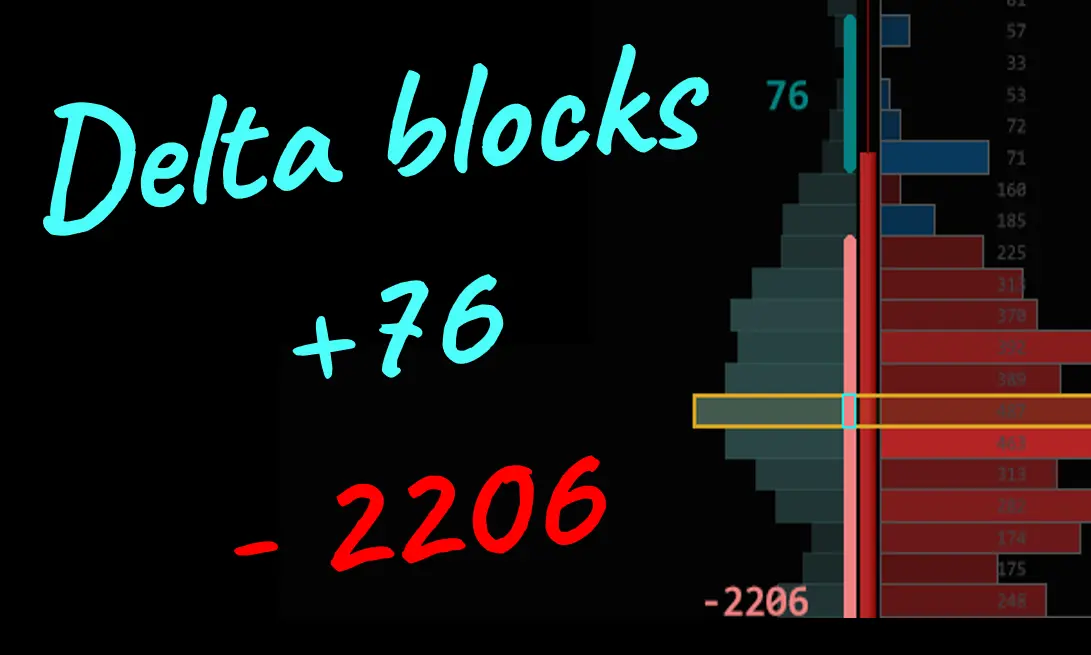
Best OrderFlow displays the total delta on the footer as well, but we also display the delta inside the candle as it grows. The delta bar along the candle indicates additional information: the price levels at which a significant delta builds up. The delta bars are calculated in real-time, unlike most other old-school footprints, which are calculated at the close of the bar. Based on the Delta Blocks, we can get delta zones for support and resistance.
POC: price with the highest volume traded in a candle bar is POC - Point of Control (colored in yellow)
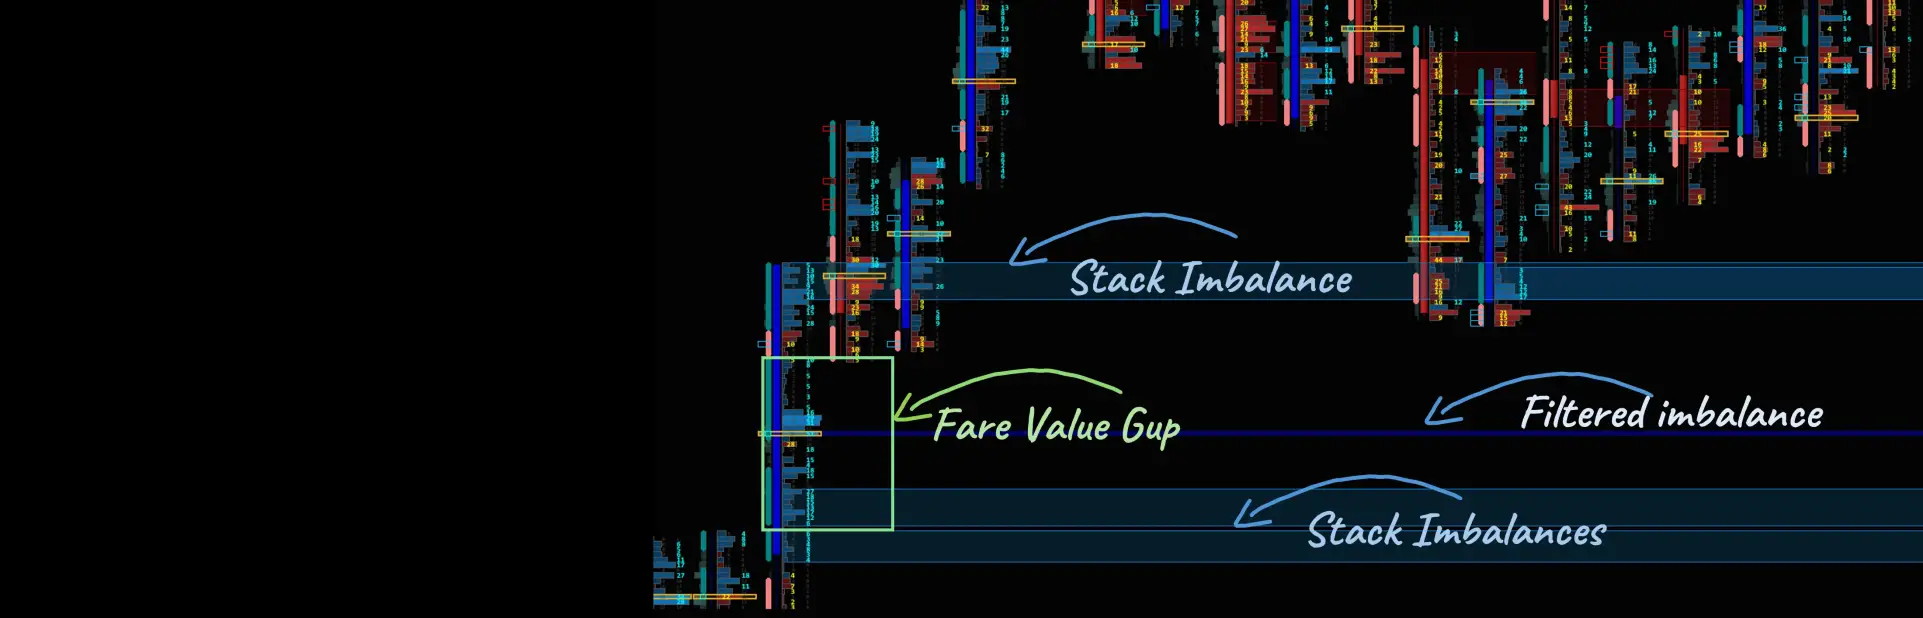
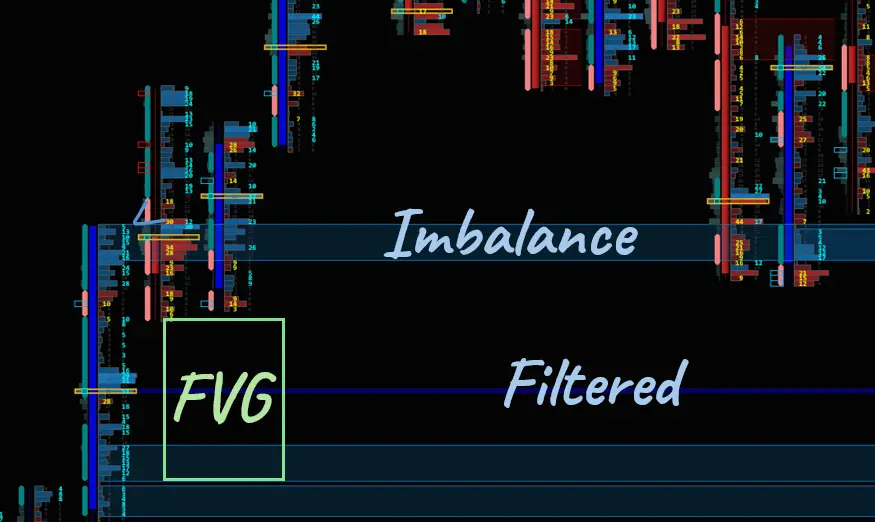
IMBALANCE: Single Filtered imbalance, Stack Imbalance, Fare Value Gap
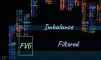
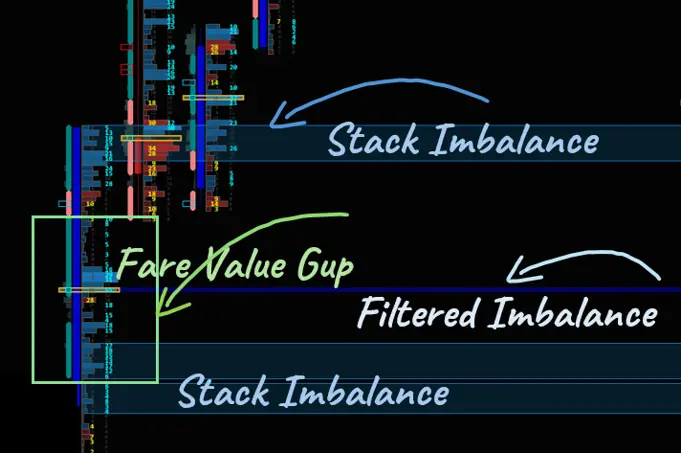 IMBALANCE: Footprint Imbalance - The footprint imbalance can display simple and stacked calculated imbalances. An imbalance between orders occurs when orders on one side are significantly more prevalent than those on the other side, and the price extends without resistance, creating an impulse move.
Fare Value Gap FVG is a type of imbalance that is easy to spot and used in a smart money concept/price action trading. Smart Money Traders can advance their trading with a footprint imbalance.
A single filtered imbalance is used for a straddle price reaction, pullback, and reversal strategies. It was developed at the special request of one of our influential traders. Prices tend to respect single imbalances a lot.
STACK IMBALANCE:
An imbalance in the market occurs when there is a significant difference between buy orders at the Ask and sell orders at the Bid. The imbalance is shown when the bid and ask exceed a specific ratio (210%-230%). A stacked imbalance happens when multiple imbalances occur consecutively across price levels, signaling either aggressive buying or selling.
ABSORPTION:
The footprint can reveal price absorption areas left of the candlebar with bright rectangles. (usually at the top or bottom with a red or green outlined rectangle). Absorption showed an aggressive side Level 1 sellers or buyers were absorbed by Level 2 passive (limit) orders in the opposite direction. Absorption or repeated absorption is a precursor for trend reversals and an indicator of support and resistance zones.
FOOTPRINT STYLE: DELTA
Delta Zone + Delta Profile + Delta Block+Delta Trend
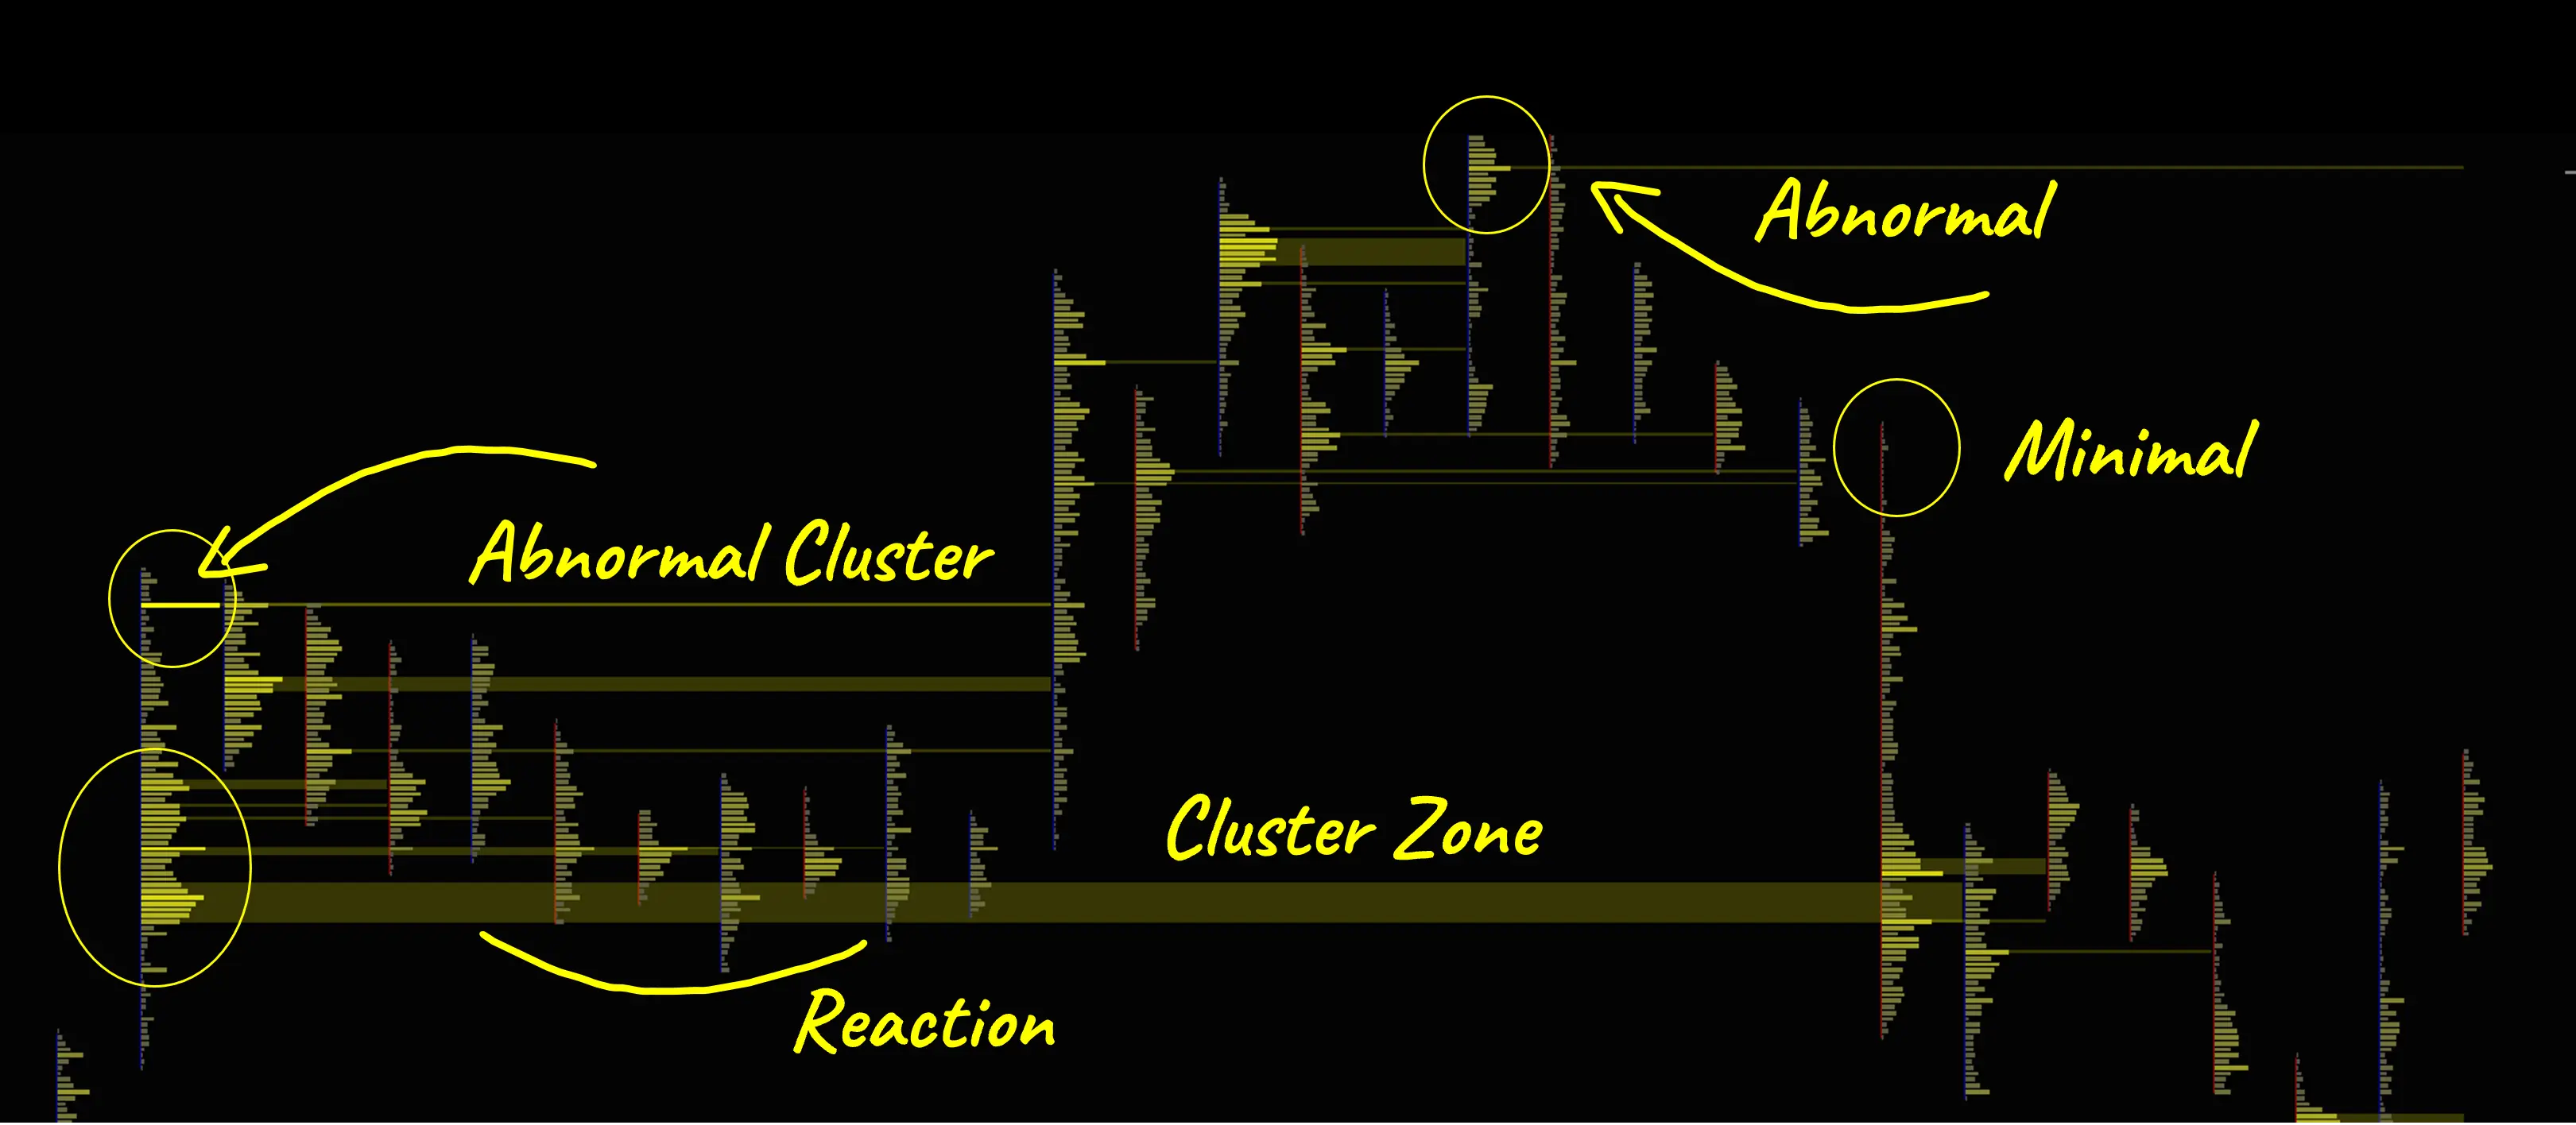
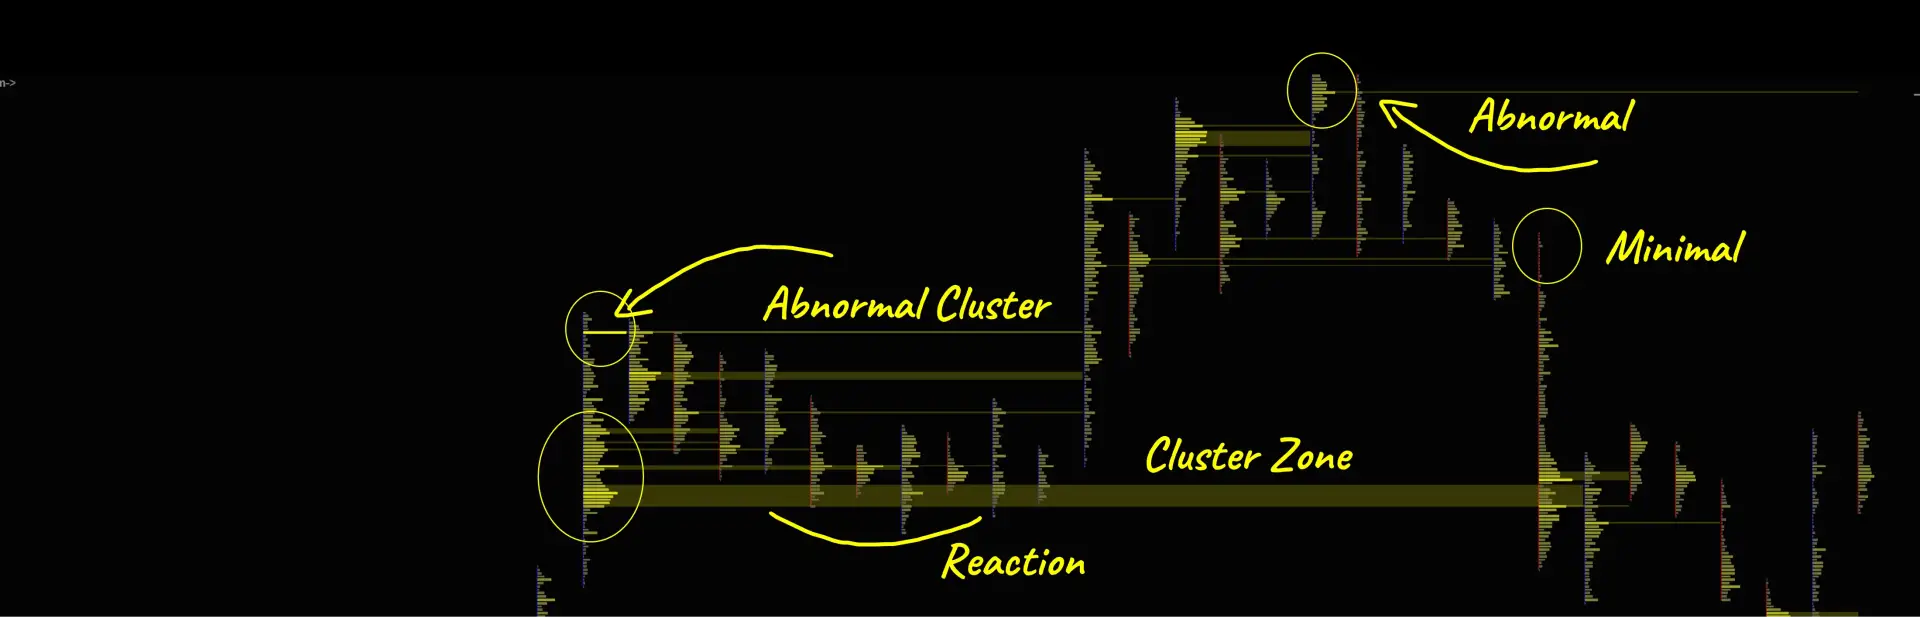
FOOTPRINT STYLE: CLUSTERS:
Footprint is a great indicator for clusters. Cluster patterns can be traded with high precision and a high win rate.
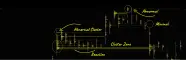
Cluster is a significant volume traded on the footprint. It indicates high trading activity at specific price levels. An unusually high volume characterizes an abnormal cluster compared to the average trades above and below. Clusters are areas of interest and respected by price as support and resistance zones, areas for re-test. The clusters trading system is a popular way to trade footprint and volume profile.
- Large clusters are often used for positioning stop losses and take profits.
- Minimal clusters are a great indication of trend exhaustion and a good entry point for a trade.
The footprint indicator can be set to make a cluster style as shown in the image below. You are welcome to use our ready-to-use template for a cluster style.
THREE MAIN REASONS TO USE BOF FOOTPRINT
Would you know why professionals dump old school footprints and use BOF Footprint instead?
1) Speed and Automation
BOF Footprint is the fastest ever footprint for manual trading and trading with automation, algo, and bots. All and every other footprint out there is lagging behind BOF Footprint. Any automation developed on a lagging Footprint suffers from stealing profits on every single trade. Any automation developed on a lagging Footprint is defective by default. Every millisecond delay in automation can make or break your strategy and your bank account. The more other indicators on a chart besides Footprint, the less likely a chart is to execute in real time.
Measure:
Test. Test and Test. Test it yourself to verify the actual data and make an informed decision.
Test your favorite footprint running with a heatmap from any source, including paid NinjaTrader, on the same chart. Measure the delay/ lag on that chart performance during the NY open, high volatility, and high ATR.
Measure with any utility or with our Deposit Killer. Deposit Killer can measure chart performance in real time. Conduct a few tests on your own so you don't have to rely solely on our conclusions. In multiple tests for Footprint and Heatmap, we found that BOF - BestOrderFlow is the champion for utilizing a Footprint with multiple other indicators and a Heatmap NT on the same chart.
2) Footprint integrated with Heatmap
BOF Footprint is integrated and runs smoothly on Heatmap and MBO. We do not guarantee the performance of other footprints on our Heatmap NT and MBO indicators. Manual or automated trading is conducted at the highest speed possible, utilizing indicators Level 1, Level 2, and Level 3 on the same chart.
3) Footprint integrated with MBO Dom Market By Order
COMPLETE ORDERFLOW
Would you prefer to trade a Complete Orderflow?
Now you can work with all indicators using Data Level 1, Data Level 2, and Data Level 3 on the same chart. Now you can use both sides of orderflow and market participation - the aggressive and passive sides of the market. Now you are able to make more informed decisions then before:
FOOTPRINT STYLES PRESENTATION:
Level 1- Aggressive Volumes indicators: Day Trading, Scalping, micro scalping
Advanced Footprint styles:
- 4 Columns
- Inside Delta Blocks
- Delta Zones
- Cluster zone
- Imbalance zone
- Delta Visualization style
Select style to view:


FOOTPRINT STRATEGIES:
Strategies based on Footprint:
- Imbalance, Stack Imbalance, Single Imbalance, Support and Resistance zone, Delta Diversion, Cluster patterns, Delta zone, Pig Tail Trend Momentum, Pullback, Front running, Absorption, Trend reversal, Order block, Fare Value Gaps. Delta Volume Profile, Delta Blocks. Trend exhaustion, Braketrogh, False brake.
Examples of strategies from our playlist and videos are provided below.
To fully utilize Footprint capabilities, please download the manuals and watch the educational videos provided below.
Footprint Explainer Videos + PDF MANUALS + INSTRUCTIONS:
Manuals / Instructions / Explainer about how to set up Footprint:
- Footprints elements and settings manual: Download PDF Footprint User Manual

- Download the PDF instructions for the Imbalance zone and the stack imbalance
Video instructions for Footprint:
How to set up Footprint settings and preferences
Video explainer:
How to set up stocked and single Imbalances on Footprint
Explainer video:
Footprint for Clusters
1) Download the Cluster Template for footprint
2) Explainer video about Cluster Style:
Range Volume Profile and Delta Profile
1) Download PDF Volume Range Profile instructions ![]()
2) Explainer video about Range Profile:
Delta Diversions
Explained Video:
Delta Diversion
1) Explainer video for Delta Diversion:
Footprint Absorption Indicator
1) Download the Absorption indicator PDF User Manual ![]()
Trades: trades visualisation indicator
1) Download Trades Visualisation indicator PDF Manual ![]()
2) Watch Trades explainer video:
IMPORTANT LINKS
Pack 1 indicators list and links (links open in a new window) :
- Footprint (click to learn more): Bid/ Ask, Stack imbalances, Filtered imbalances, Clusters, Absorption, Diversions, Delta blocks, Delta visualization, Link: Read all about Foorprint
- Volume profile (click to learn more) is a horizontal histogram that displays the volume spread across vertical price levels. It shows traders where the most activity occurs at specific price points. The volume profile provides insights into market liquidity and potential support and resistance levels. Link: Read all about Volume profile
- Footer (click to learn more) : Volume, Delta bid and Ask,
- Market Speed indicator (speed of tape),
- Absorption Footprint indicator.
- Utilities (click to learn more): Trades visualization, Chart Scroll
- Templates for Pack 1 Indicators included.